As you maybe have been able to tell by looking at all the work I've done on the content of this site so far, I'm interested in depth in the NHL.(1) As such, I keep looking at the depth charts I've created that track live data. In particular, one thing I kept noticing anecdotally was that when the low-depth team won a game, it would often come along with a goalie that was absolutely standing on his head. Or, conversely, an opposing goalie that had a huge underperformance. Specifically, I'd notice on Moneypuck that Goals Save Above Expected (GSAx, the difference between the xG a goalie faced and the actual goals scored) was outsized in one way or another.
The game that really kicked off this analysis was specifically watching the Oilers game on December 29, 2025. The game itself, and a lot of the rhetoric around the game, was how the Oilers bottom six were underperforming, and how Pickard single-handedly gave the Oilers the dub.(2) In this game, the Jets had higher depth relative to the Oilers (.347 vs. .293).(3) But the Oilers won 3-1. If you look then at the goaltending, you will see the Oilers' Pickard let in 1 against 4.246 xG (+3.25). The Jets' Hellebuyck, on the other hand, let in 2 against 3.320 xG (+1.32).(4) The data really don't support the notion that Hellebuyck played poorly, but instead that Pickard truly stood on his head.
This led me to start really considering the relationship between depth and goaltending, seeking an answer to a sensical question: if you play with more depth, can you get away with worse goaltending? Or, stated another way, does higher depth buy you some wiggle room for a bit shakier goaltending?
Depth Reduces the Demand on Goaltending
If higher depth does in fact mean that you can get away with shakier goaltending, we would expect to see GSAx to be a bit higher when depth is lower. That is, when a team doesn't have the depth to create offensive pressure, goaltending has to make up for it in order for them to win. So, I took the average GSAx (agnostic of actual goaltender) when the team that played with lower depth wins, the team that played with higher depth wins, and when depth was roughly equal (i.e., within 0.05 of each other).
What we can see in the figure below is that when the lower depth team wins they need about 0.5 higher GSAx to compensate (t(18,686) = 23.301, p < .001, Cohen's d = .315) compared to a high depth team. This translates to 41 extra goals that need to be stopped over an 82 game season. This 0.5 GSAx difference implies that, conditional on winning, low-depth teams tend to require substantially above-average goaltending performances. In practice, this suggests far less margin for error at the goalie position when depth is lacking.
This is not a trivial difference. Currently, the top goalie in the NHL with 10+ games played as of today (out of 66 total), ranked by GSAx per 60, is Devin Cooley with .755. Subtracting 0.5 brings us to a GSAx of .255, the territory of Spencer Knight (.265) and Thatcher Demko (.241), ranked 21st-22nd among qualified goalies. So to compensate for low depth, you need to move your goaltending from average to elite.
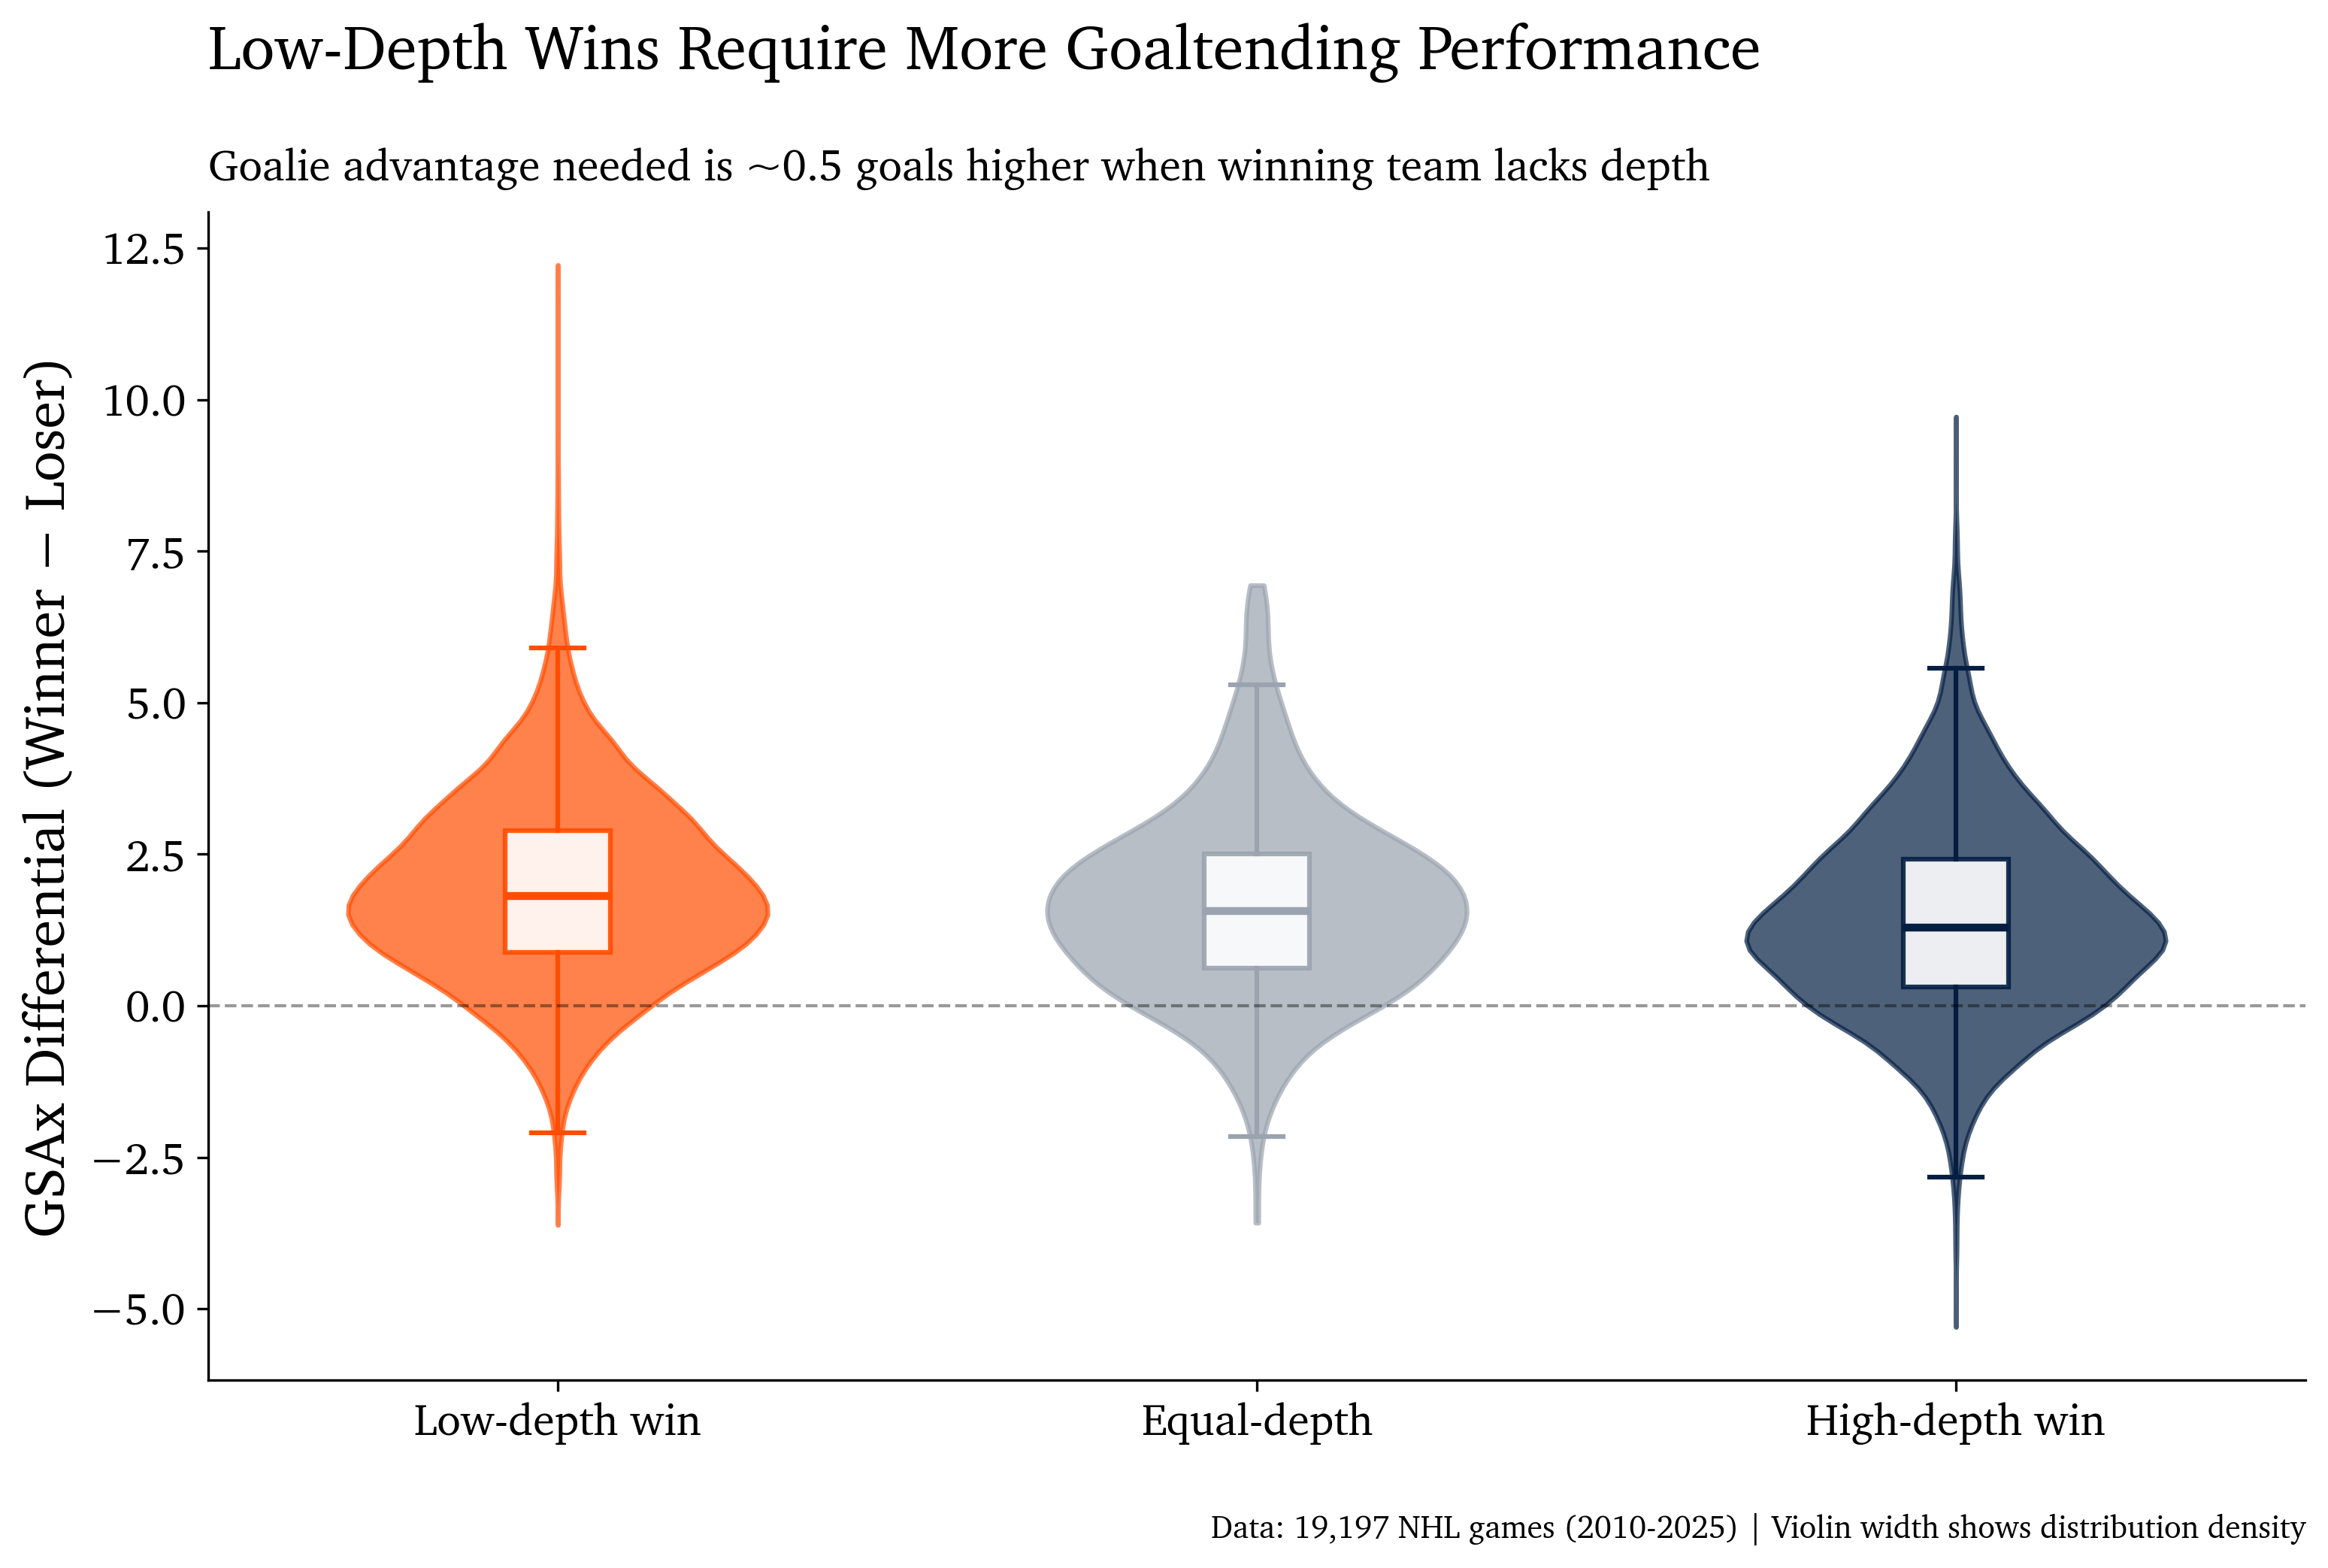
Notably, when depth is roughly equal between teams, the goaltending differential sits near the middle (~0.25 GSAx). Winning still requires some goalie advantage, but not to the degree of high versus low depth matchups. This equal-depth baseline reinforces that you need an edge somewhere; being matched on depth means the goalie becomes the tiebreaker. It's worth noting that in the 18,688 games I analyzed, only 509 of them were matchups of equal depth. Most nights, one team has a clear depth advantage, which means the compensatory relationship with goaltending is almost always in play.
The Relationship Scales Predictably
This 0.5 goal compensation for low-depth wins is not just at the extremes. The figure below bins all games by depth advantage and plots the average GSAx differential required to win.
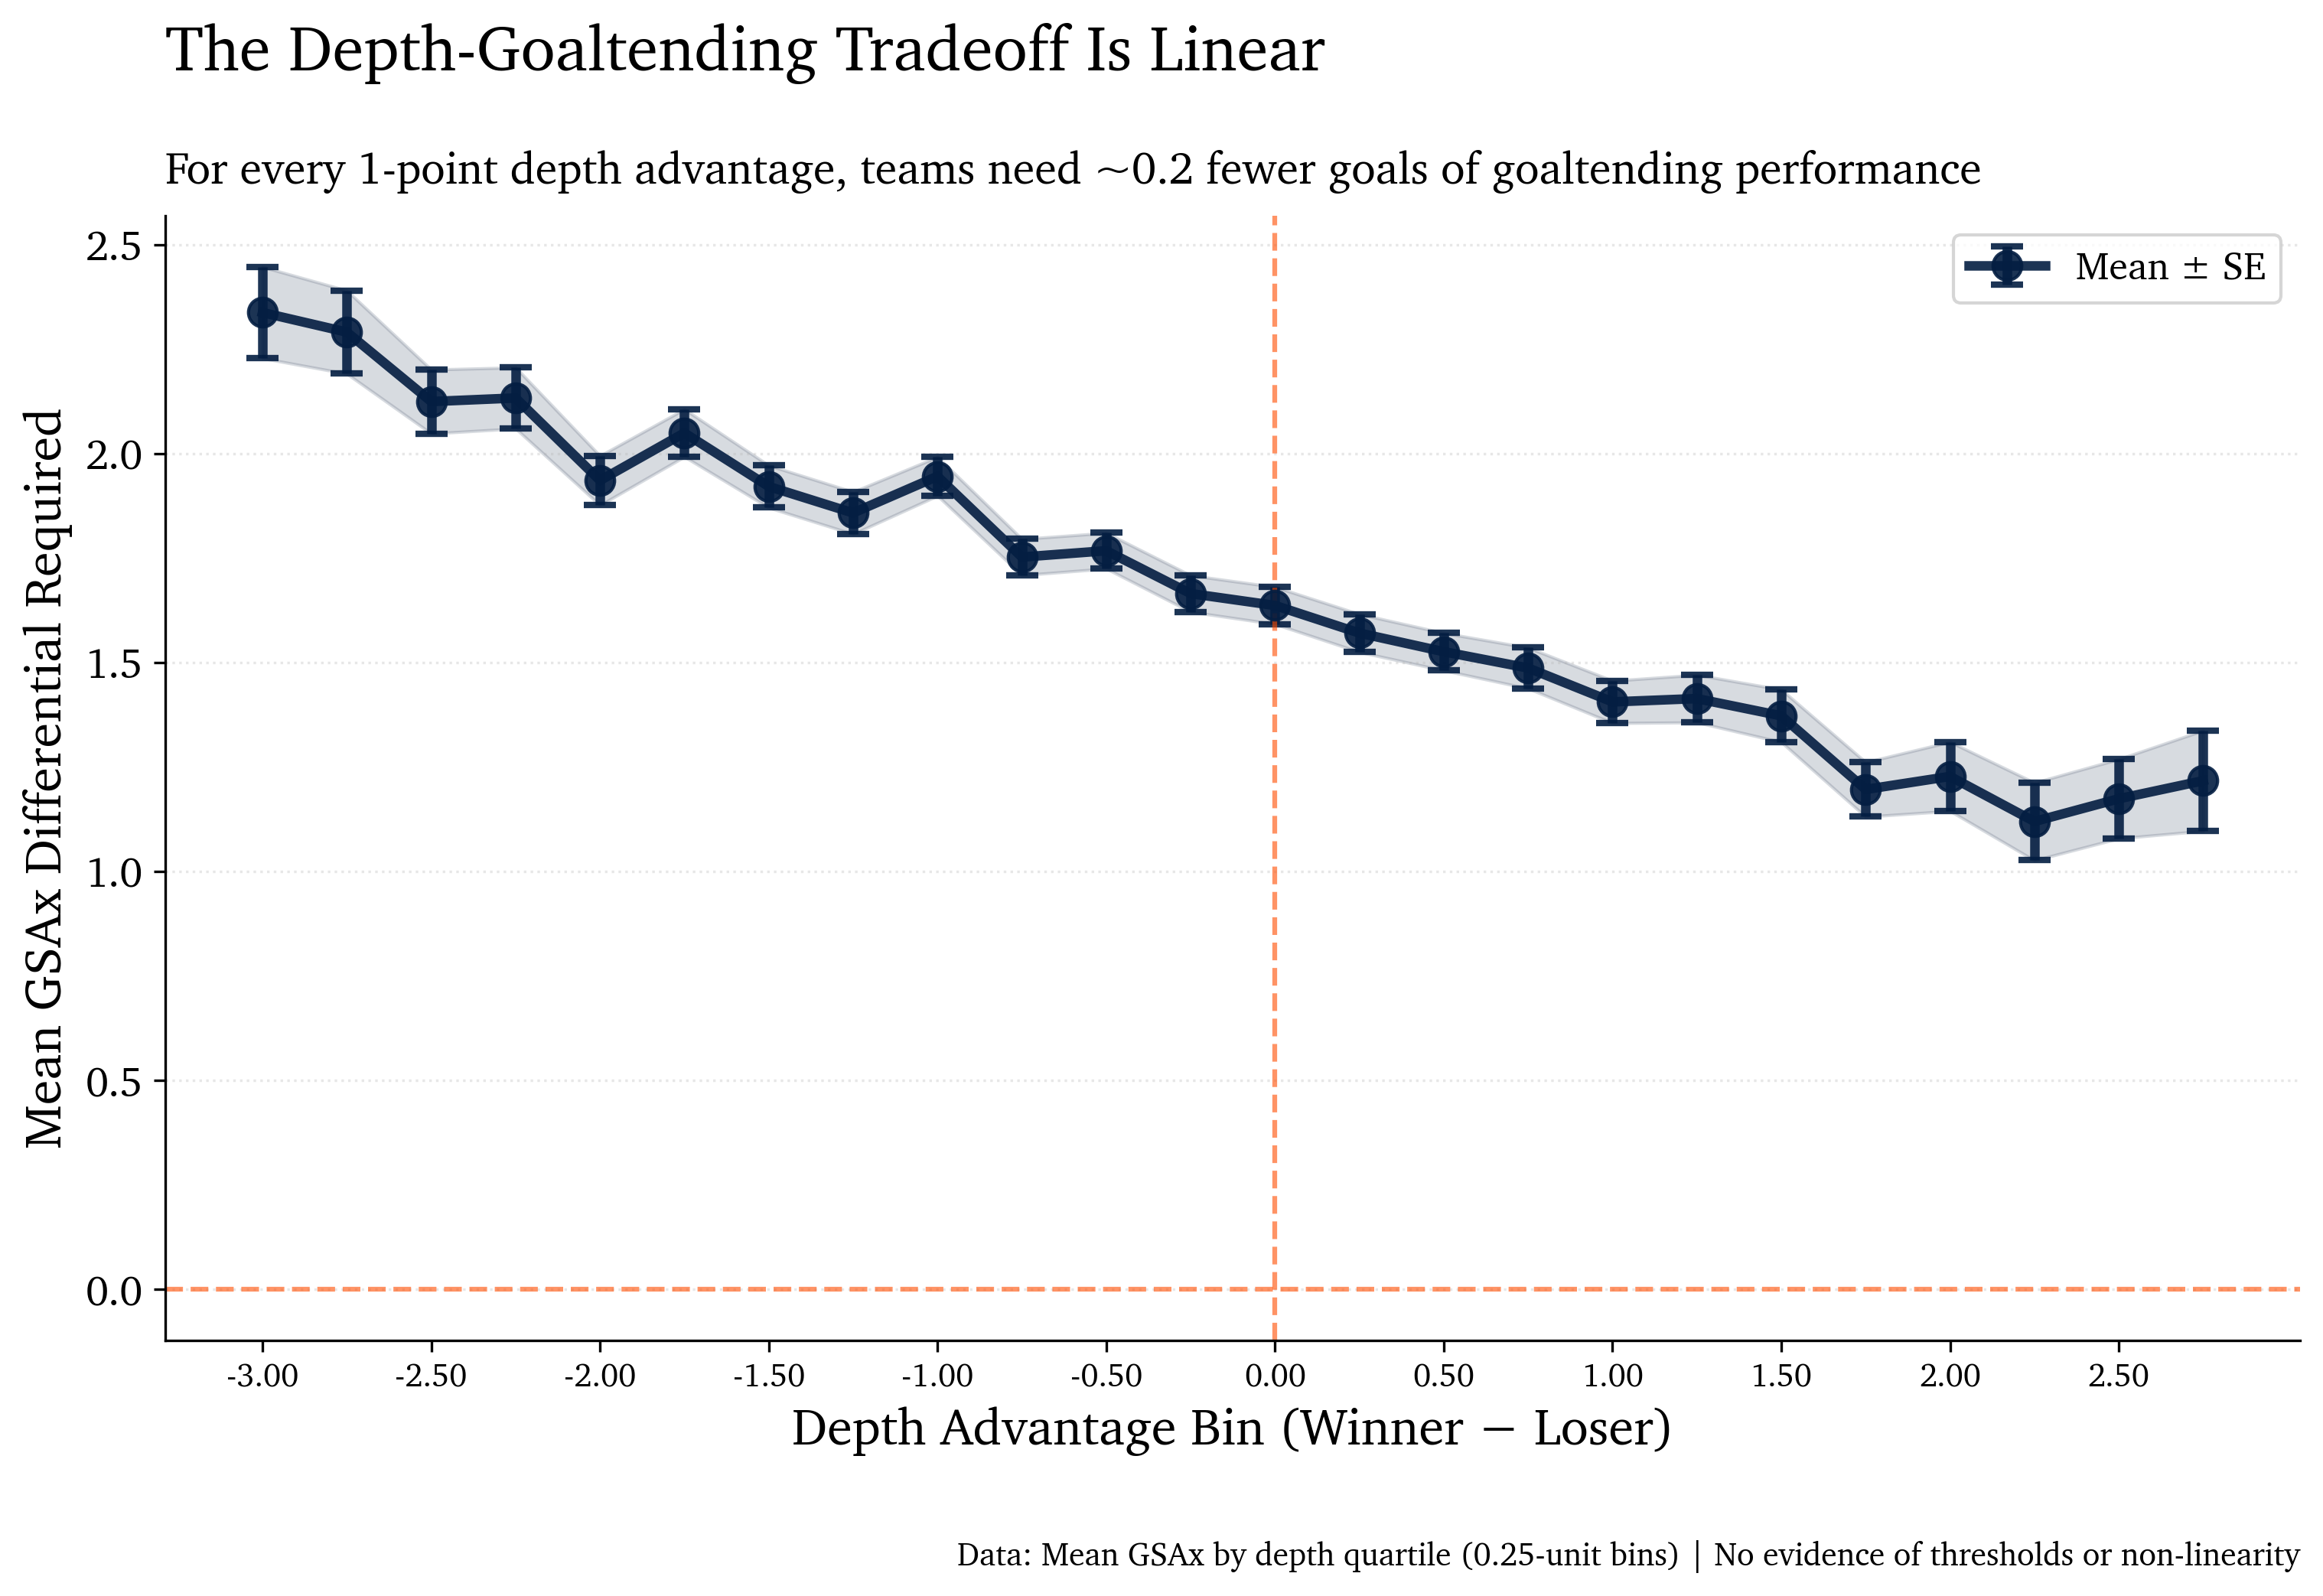
For every 1-point increase in depth advantage, teams need approximately 0.21 fewer goals of goaltending performance (slope = -0.206, R² = 0.97, p < .001). This holds from depth differentials of -3 (massive disadvantage) to +3 (massive advantage), covering 96% of all NHL games in the dataset. Over 82 games, a 1-point depth improvement translates to roughly 17 fewer goals your goalie needs to save.
So this provides clear evidence quantifying the depth-goaltending relationship. Building a superstar-driven roster isn't inherently bad, but it materially increases dependence on elite goaltending. When depth is thin, average goaltending is less likely to be enough on a consistent basis, making the strategy higher variance and more fragile to performance dips. If you are going to take the superstar strategy, you have to factor in a goalie as one of your stars.
You Can't Win with Depth Alone
Okay so we see that low-depth teams need more goaltending to win. This raises a natural follow-up question: what does this look like across all games, not just wins? If depth and goaltending truly compensate for each other, we should see a systematic pattern where teams can win by leaning on one, the other, or both.
The figure below maps every game in the dataset as a single point, plotting the winner's depth advantage (x-axis) against their goaltending advantage (y-axis). The orange trend line shows a smoothed regression line, revealing the overall relationship.
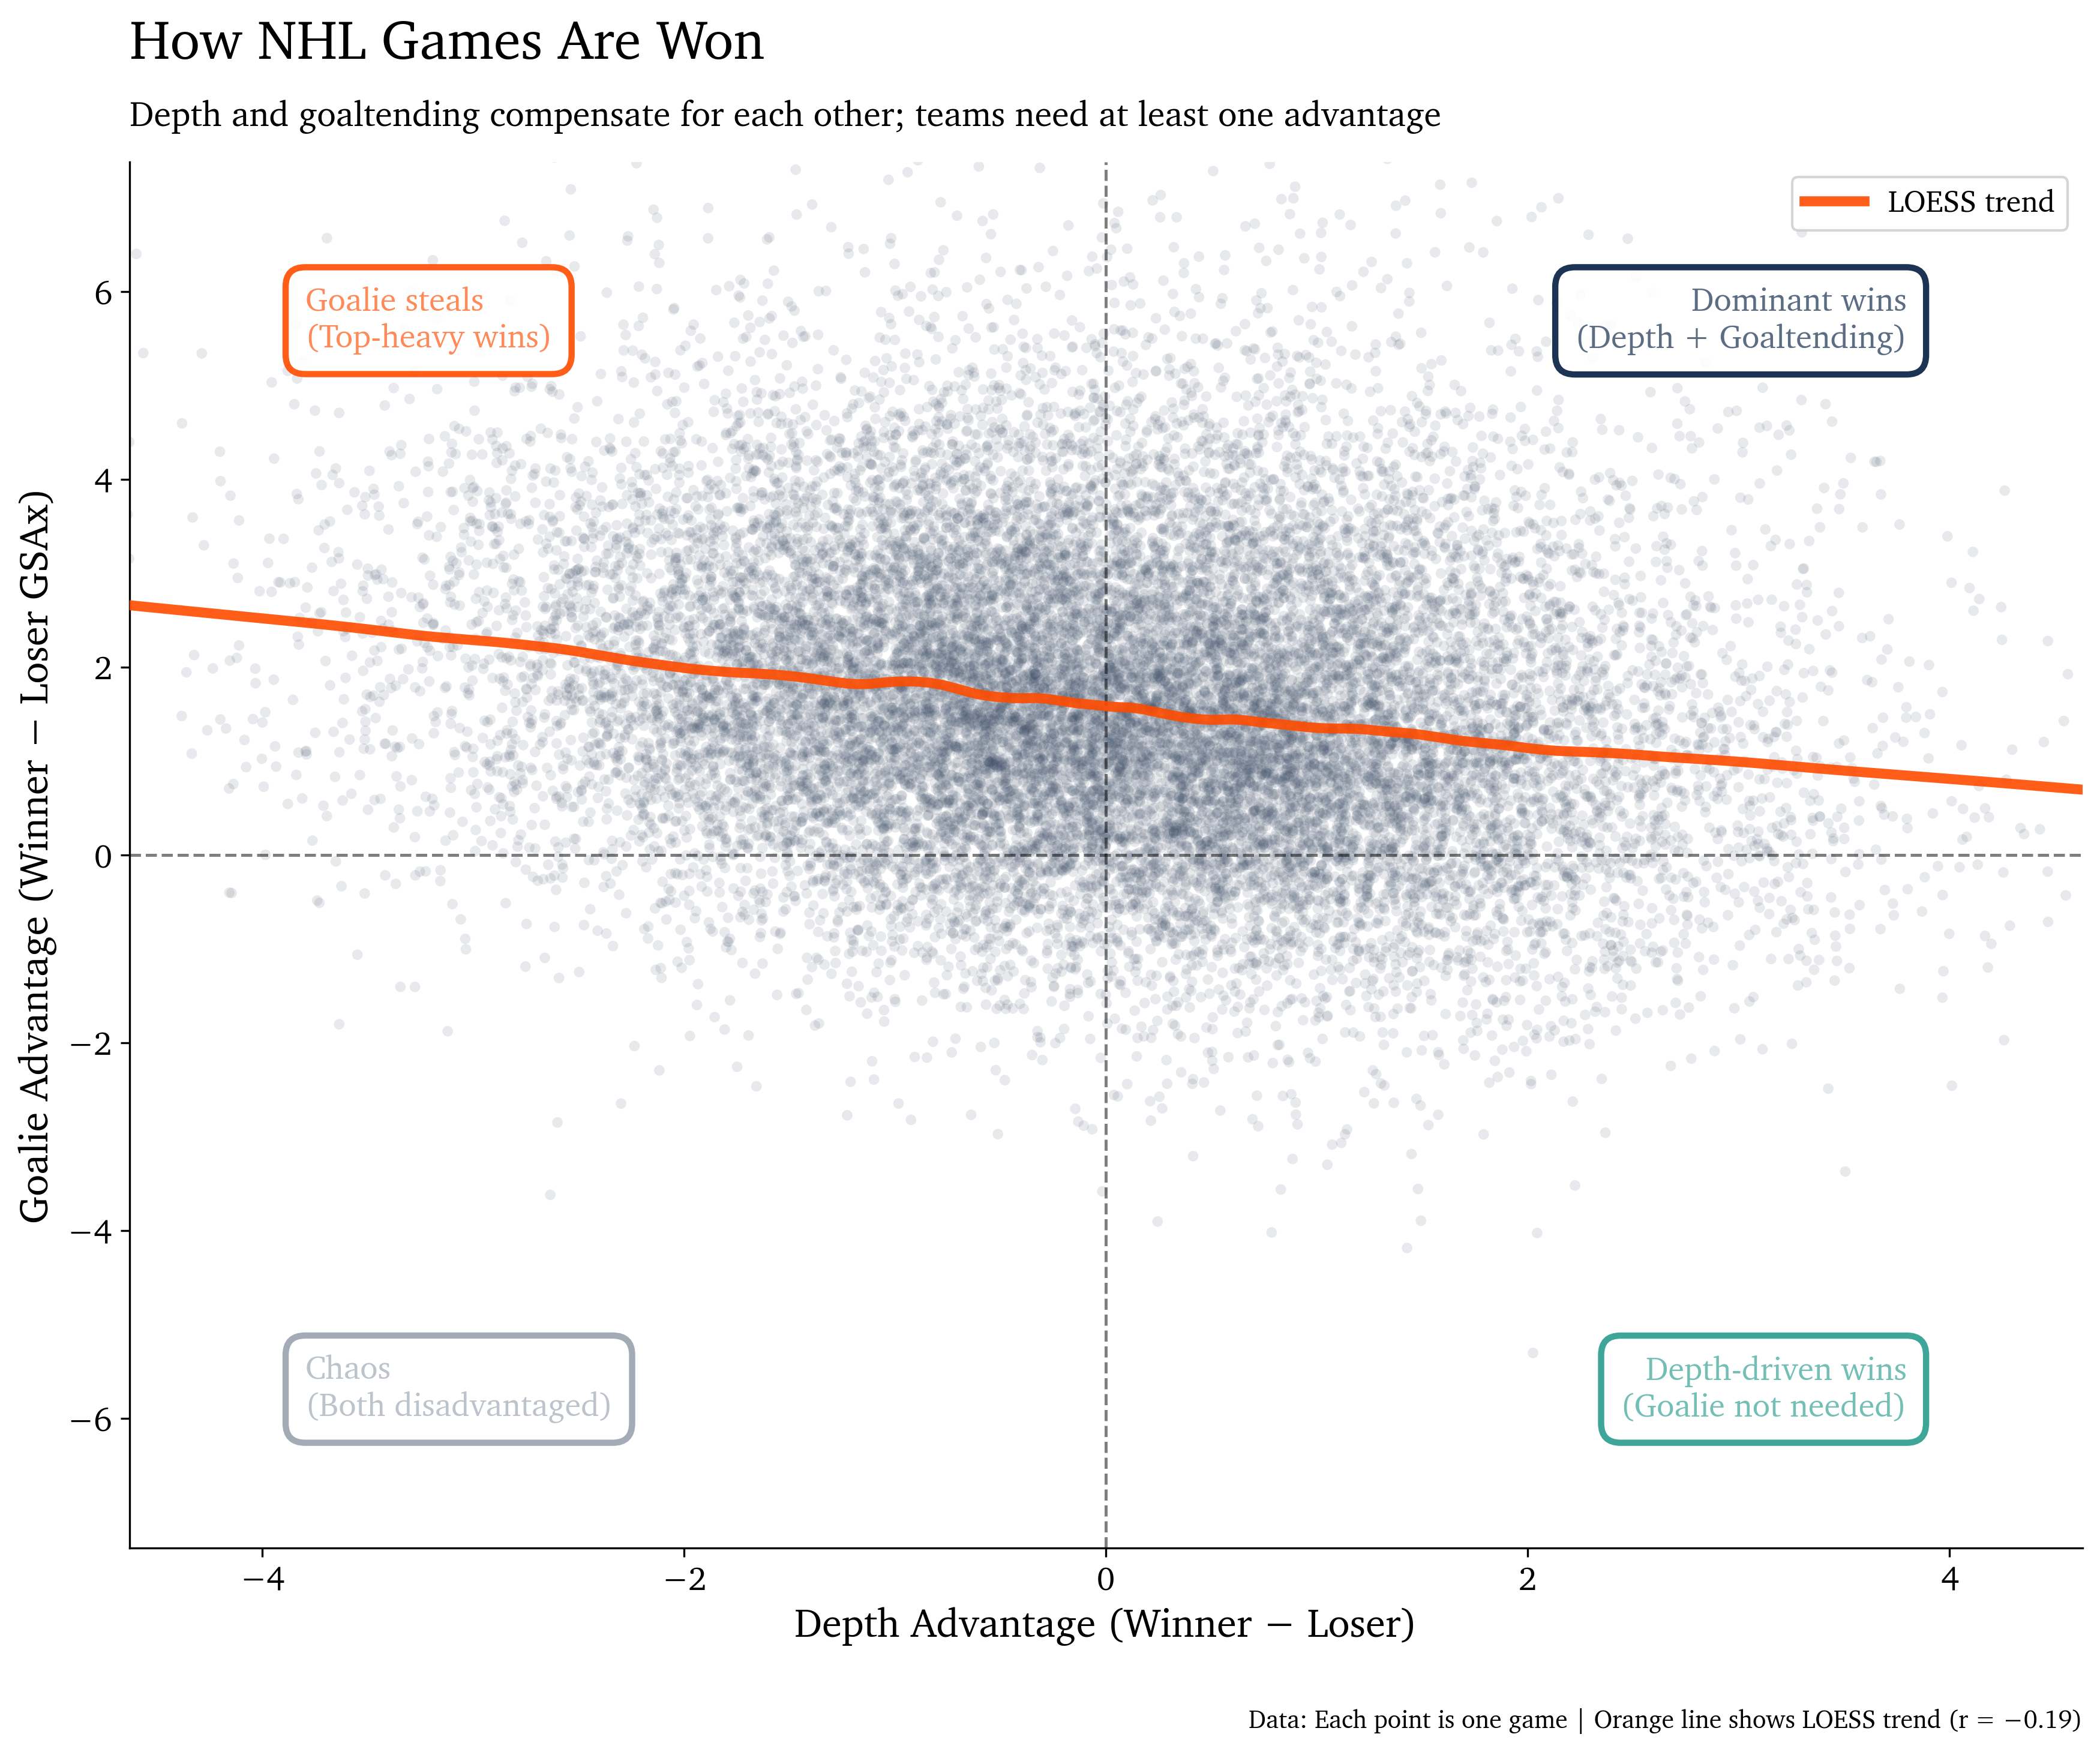
The downward sloping orange line shows us that depth and goaltending trade off against each other (r = -0.19, p < .001). When a team wins with a depth disadvantage, they almost always compensate with a goalie that outperforms their opponent's goalie. When a team wins with superior depth, they need slightly less goaltending over-performance.
The 5:1 Asymmetry: Goaltending Trumps Depth
Dividing the plot into quadrants reveals an imbalance in how teams actually win:
Dominant wins (upper-right): 7,811 games (40.7%) — Both depth and goaltending advantages
Goalie steals (upper-left): 8,714 games (45.4%) — Elite goaltending compensates for shallow roster
Depth-driven (lower-right): 1,739 games (9.1%) — Depth compensates for poor goaltending
Chaos (lower-left): 933 games (4.9%) — Worse goaltending, worse depth
86% of all wins required better-than-opponent goaltending performance. Only 9% of wins come from depth overcoming poor goaltending; A 5:1 ratio compared to goalie-driven wins. Elite goaltending but worse depth wins almost five times more often than better depth but worse goaltending. And even within that 9% slice, most of those games feature only slightly negative GSAx, not catastrophic goaltending collapses.
Contrast this with the 45.4% of goalie steals. Nearly half of all NHL wins come from teams that lacked a depth advantage but got elite goaltending. These are the Pickard-vs-Jets scenarios from above. Shallow teams surviving because their netminder stood on his head. In the messy game of hockey, these data show us that goaltending can single-handedly win games, but depth cannot.
The empty lower quadrants also tell us something important. Only 14% of wins happen when the winning team's goalie underperforms. The majority of those (9.1%) still have a depth advantage. The lower-left quadrant (Chaos, 4.9%) is nearly empty, showing that when you lack depth and goaltending, you lose.
This analysis shows us that goaltending is the foundation. Depth helps reduce how much you need to lean on your goalie, moving you from the upper-left (goalie steals) to the upper-right (dominant wins), but it cannot replace goaltending entirely. The 9% of depth-driven wins are the exception, not a viable strategy. If your roster construction plan doesn't start with above-average goaltending, your foundation is going to inherently be shaky.
Depth and Goaltending Compound at the Team Level
The game-level asymmetry is not just single-game variance. When we aggregate across full team-seasons from 2010-2025, the pattern persists. I classified every team-season based on their average advantages across all games. Elite teams have both a depth advantage (>0.05) and a goaltending advantage (>0.2 GSAx). Goalie-dependent teams have the goaltending but lack the depth. Depth-driven teams have the depth but lack the goaltending. Balanced teams have neither advantage. Struggling teams are disadvantaged in both.
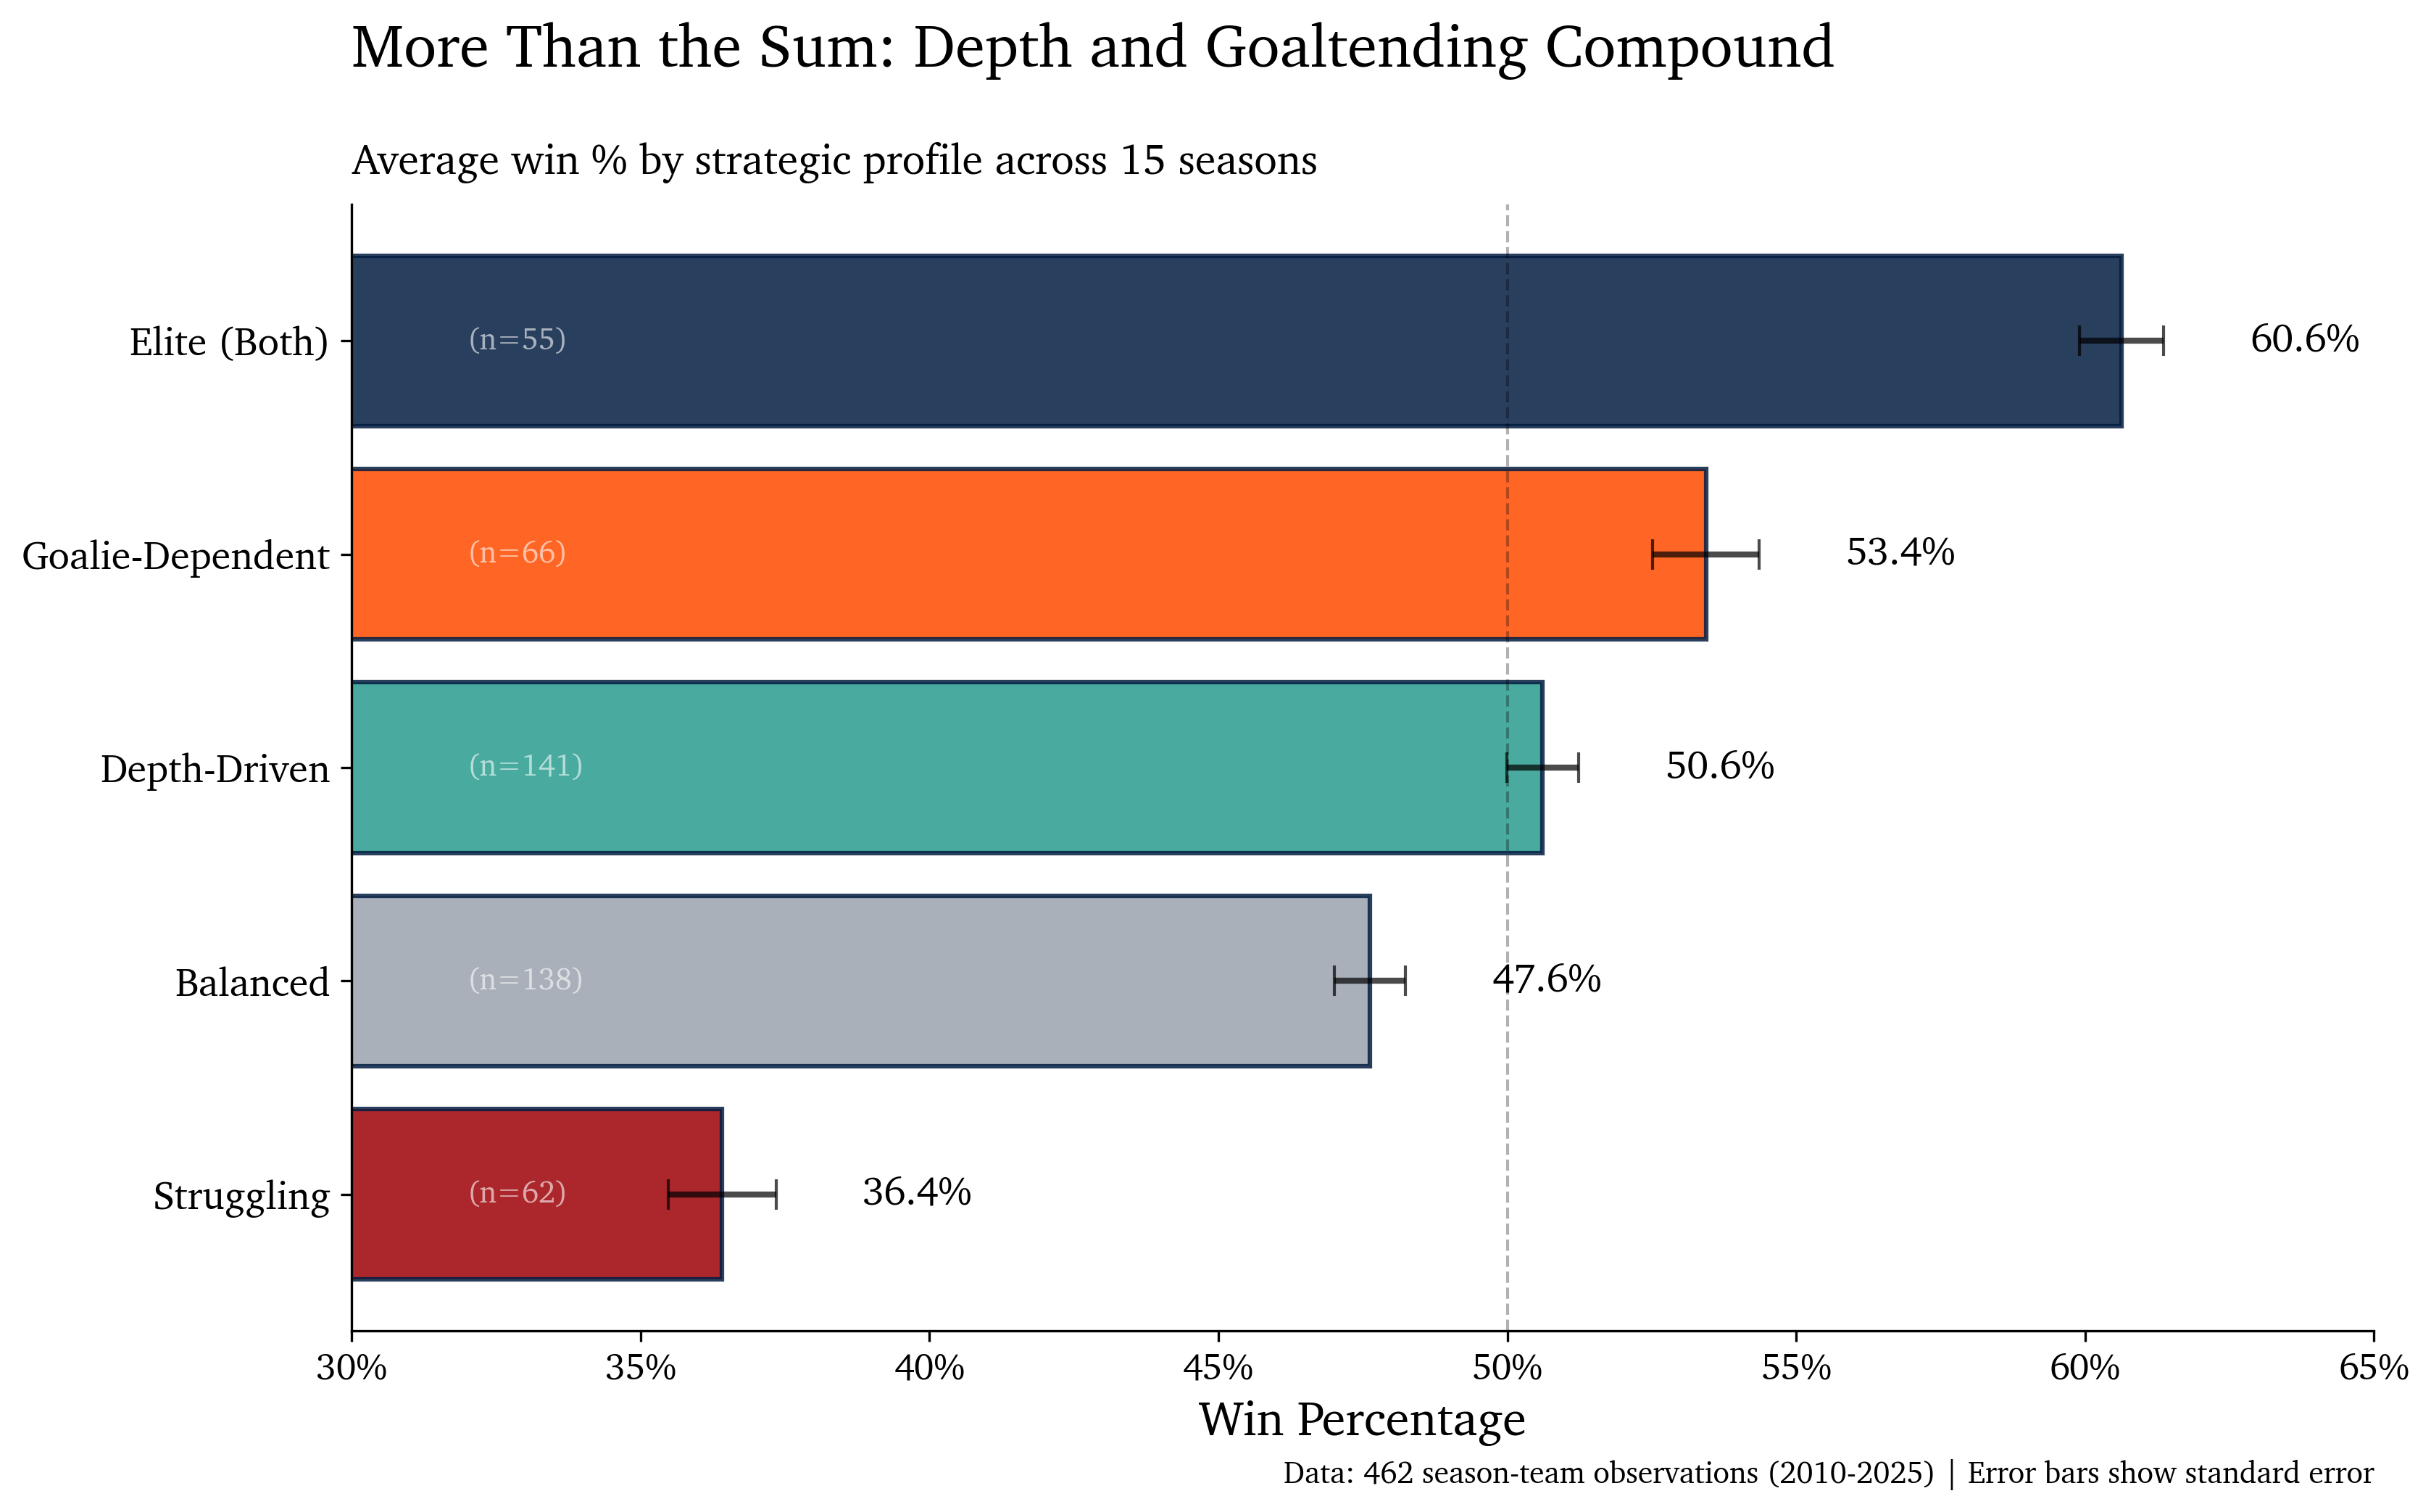
As you can see in the figure above, the elite teams with both advantages win 61% of their games. Goalie-dependent teams win 53%, depth-driven teams win 51%, balanced teams win 48%, and struggling teams win 36%. Goalie-dependent teams outperform depth-driven teams by 2 percentage points across 400+ team-seasons. This validates the asymmetry we saw above. Individual games show goaltending can single-handedly win (45%) while depth alone rarely does (9%). Full seasons show goalie-dependent teams winning 54% versus depth-driven teams winning 52%.
Depth-driven teams still win more than half their games, so it is not a losing strategy. But, if you had to choose one, it is clear that goaltending is the safer bet. The balanced teams have no clear advantage in either dimension, and they win exactly 50% of their games. Being mediocre at both does not compound into competence.
The Shape of Depth and Goaltending in 2024-2025
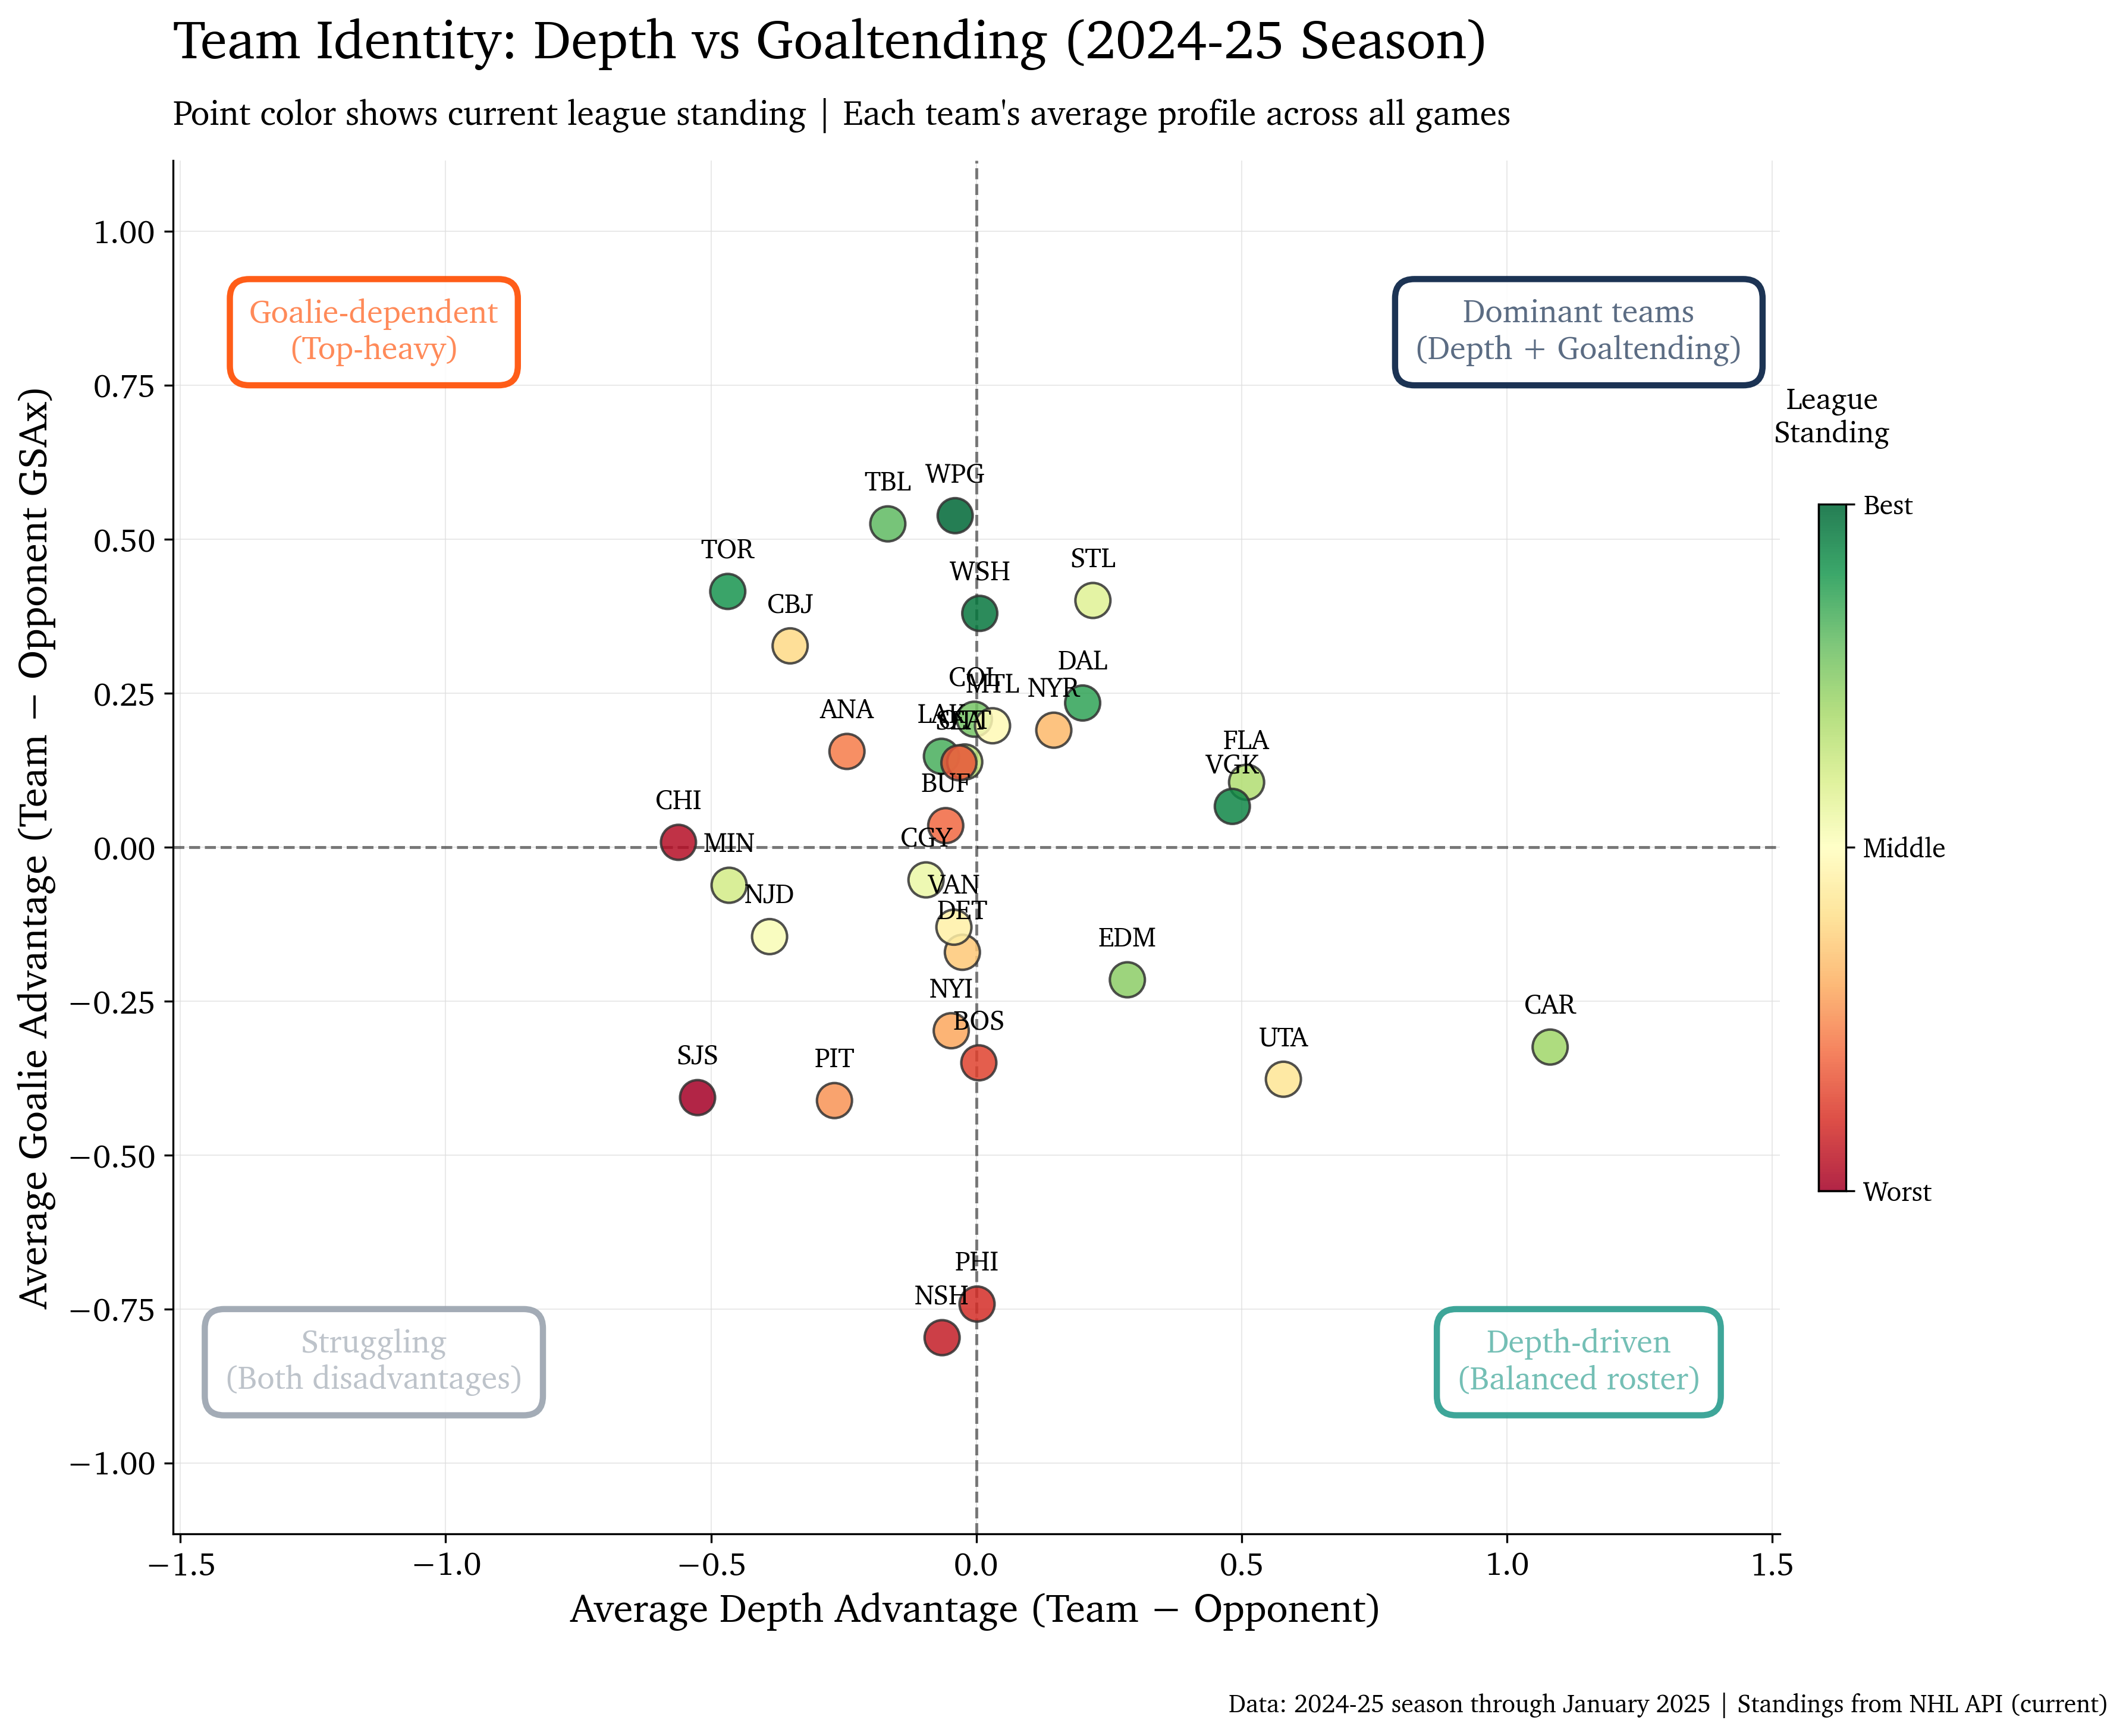
Now we know that goaltending is the foundation and depth is the enhancement. But what does this actually look like for real teams right now? Or, well, at least when we have the most complete data. The figure below maps each NHL team's average profile across all their games last season. Position on the plot reflects their overall team identity with respect to depth and goaltending.
The color coding shows league standing (green = better, red = worse), and you can visually see that there is more green above the goaltending advantage line, and more red below it; teams with positive goaltending advantages cluster toward the top of the standings. In this team-level analysis, we can see that better-than-opponent goaltending is correlated with higher league standings (r = -0.621, p < .001). Depth on its own is not significantly correlated with better league standings (r = -0.320 p = .074), but it's worth noting we're dealing with the small n of 32 teams last season.
The Four Quadrants in Practice
Dominant (7 teams): Both depth and goaltending advantages, average league rank of 10.6, and a .552 win percentage. Washington (2nd), Vegas (3rd), Dallas (5th), and Florida (11th) all live here. These teams built complete rosters. They won in multiple ways, which made them resilient.
Goalie-Dependent (11 teams): This is the most common strategy in the NHL right now, and it includes the league's best team last year. Winnipeg ended the season in first place with an average GSAx advantage of +0.538 despite a slightly negative depth advantage. Toronto (4th), Tampa (7th), and Colorado (8th) all lean heavily on goaltending to compensate for depth deficits. But this quadrant is not just for contenders. Seattle (27th) also lives here, showing that goaltending alone is not enough if the gap is too large. The average rank is 15.2 and win percentage is .509, which is solidly middle-of-the-pack.
Depth-Driven (5 teams): This is the rarest strategy, and the results are mixed. Carolina (10th) had the highest depth advantage in the league at +1.081, but their GSAx was -0.325. They are winning (.577 win percentage) despite below-average goaltending. Edmonton (9th) was similar, +0.285 depth, -0.215 GSAx. These two teams are the exceptions to the rule. The rest of this quadrant struggles: Boston (28th), Philadelphia (29th), and Utah (19th) all have positive depth but worse goaltending, and they are not winning. Average rank is 19.0, with a win percentage of .488.
Struggling (9 teams): The largest quadrant. Negative advantages in both depth and goaltending, average rank of 21.3, win percentage of .435. Nashville (30th, -0.797 GSAx) and San Jose (32nd, -0.407 GSAx, -0.525 depth) anchor the bottom. Minnesota (13th) and Calgary (15th) are the outliers here, barely in this quadrant and fighting to stay alive.
Conclusions
I started this analysis watching Pickard steal a game for the Oilers against a deeper Jets team. The data largely confirm what I've been noticing anecdotally: depth and goaltending compensate for each other in predictable, quantifiable ways.
Three main findings stand out. First, the compensation is linear and stable. For every point of depth advantage you build, you need 0.21 fewer goals of goaltending performance. This exchange rate has held steady across 15 seasons, from 2010 through 2025. There are no thresholds where depth suddenly becomes more or less valuable.
Second, the relationship is asymmetric. Goaltending can single-handedly win games when teams lack depth relative to their opponent. Depth advantages alone only win games 9% of the time. At the team-season level, goalie-dependent rosters win 54% of their games versus depth-driven rosters winning 52%. The difference is not enormous, but it is consistent. Goaltending is the foundation and depth is the enhancement that moves you from competitive to dominant. Notably, teams that have both depth and goaltending advantages win 61% of their games.
Third, being mediocre at both is worse than being elite at one. Balanced teams with no clear advantage win exactly 50% of their games. The gap between having both edges versus having one is smaller than the gap between having one edge versus having none. This suggests that specialization is viable, but hedging is generally not.
What these data provide is a framework for structuring a roster when it comes to the depth and goaltending tradeoff: (a) Your goalie needs to produce 0.2 fewer GSAx per one point increase in depth, (b) goaltending alone is more likely to produce wins than depth alone, and (c) committing to an identity, whichever one you choose, is better than splitting the difference.