Trying to understand why one team wins and another loses is a perennial focus of sports analytics and punditry. When trying to explain matchup outcomes, commentators and fans alike often move past what we can directly observe and into the world of "intangibles." Concepts like “momentum,” “chemistry,” or "depth” that go beyond simple statistics like shot counts, goals, or points. Researchers have even shown that these constructs can influence outcomes, yet they remain notoriously difficult to define and measure.
In this post, I’m going to provide a bird's-eye view into how we can leverage the psychometric approach of latent variable modeling to measure these intangibles. Here, I build what I call the Total Depth Index (TDI). I'll look at trends across 15 seasons of NHL hockey, encompassing over 19,000 games and millions of individual plays, to see if depth is a real, measurable quality of an NHL franchise. If you are so inclined, the full academic pre-print can be found here.
Conceptualizing Depth in the NHL
Depth in the NHL is often talked about in reference to the contributions of the "bottom six". Sports Analytics folks have traditionally tried to capture this with various proxies, like the average ice time of those third and fourth lines, points attained by the bottom six, the number of players with high "Game Score Value Added," or actual salary distribution. However, this relies on single measurement indicators that don't fully capture the complexity inherent in such intangible constructs. So, depth could be better conceptualized as the extent to which various elements of a team’s production (think shots, goals, etc) is distributed across its players rather than concentrated within a few individuals.
A team with high depth can maintain competitive performance even when star players are unavailable or game contexts shift, because contributions to success are not driven entirely by the top lines. In contrast, a low-depth team relies disproportionately on a small subset of players whose absence or underperformance can sharply diminish team performance. In the context of the NHL, this distributional quality manifests across observable dimensions such as ice time, shot generation, and shot quality. Each of these represents a measurable indicator of the latent construct of depth; that is, how evenly a team’s capabilities are spread throughout its roster.
Measuring Depth in the NHL
To move from a rhetorical description of depth to a formal measurement, I utilized the gini coefficient, a statistical measure of dispersion typically used by economists to capture wealth inequality. In this framework, depth is the complement of inequality. A value approaching 1 indicates perfect balance (every player contributing equally), whereas a value approaching 0 indicates extreme concentration among a few players.
Using a dataset of every rostered skater, every play, and every shift since the 2010-2011 season, I modeled depth as a single latent construct made up of four observable indicators:
Shot Depth (SOGD): The distribution of total shots on goal.
Corsi-For Depth (CFD): Distribution of all shot attempts, A proxy for offensive zone pressure and puck possession.
Expected Goals Depth (xGD): The distribution of high-quality scoring chances.
Time-on-Ice Depth (TOID): How evenly a coach distributes minutes across the 18 skaters
Specifically, I computed the gini coefficient for each of the observed indicators for each team-game in the dataset. I then took the reciprocal of each gini coefficient (1 - gini) to create each individual depth measurement. Then, I combined the four measures into a single latent variable model in order to confirm these indicators all statistically "hang together" to measure a single latent construct. This model produces factor scores which then make up the numeric measurement of depth for a given team-game.

The figure above is a path diagram showing the latent variable of depth connecting to the four indicators. Note that Shot Depth and Corsi-For Depth are the strongest contributors, while TOI Depth is the weakest, suggesting that while ice time is the most equally distributed resource, it isn't the primary driver of functional depth. Its worth noting that when exploring the descriptives, TOI depth is quite a bit higher than the others, suggesting that ice time generally is a relatively evenly distributed resource.
One could argue that there are other components to depth, and I am certainly not arguing that these four indicators are the be-all end-all of measuring depth. However, they are a set of measures that conceptually capture what people tend to refer to when they speak of "depth" and, more importantly, they were widely available and accesible.
Shot Depth Example
Between 2010 and 2025, the game with the most unevenly distributed shots (i.e., highest gini coefficient for shots on goal) was played by the New York Islanders in 2014 against the Washington Capitals. In this game, the New York Islanders rostered a full 18 skaters and took 11 shots. These 11 shots came from only six out of the eighteen rostered skaters, resulting in a shot-on-goal gini (SOGG) coefficient of 0.783. Conversely, the game with the most evenly distributed shots was played by the Columbus Blue Jackets in 2016 against the Colorado Avalanche. In this game, the Columbus Blue Jackets also rostered a full 18 skaters and took 37 shots-on-goal. These 37 shots came from 17 out of the 18 rostered skaters, resulting in a SOGG of 0.158. Thus, taking depth as the complement of these shot inequalities (i.e., 1 - SOGG), the New York Islanders had a shot depth (SOGD) of 0.217, and the Columbus Blue Jackets had an SOGD of 0.842, respectively, reflecting very shallow and very deep shooting distributions. Notably, SOGD is not problematically correlated with volume metrics like total shot counts or total expected goals.
Distribution and Game-to-Game Stability of Depth
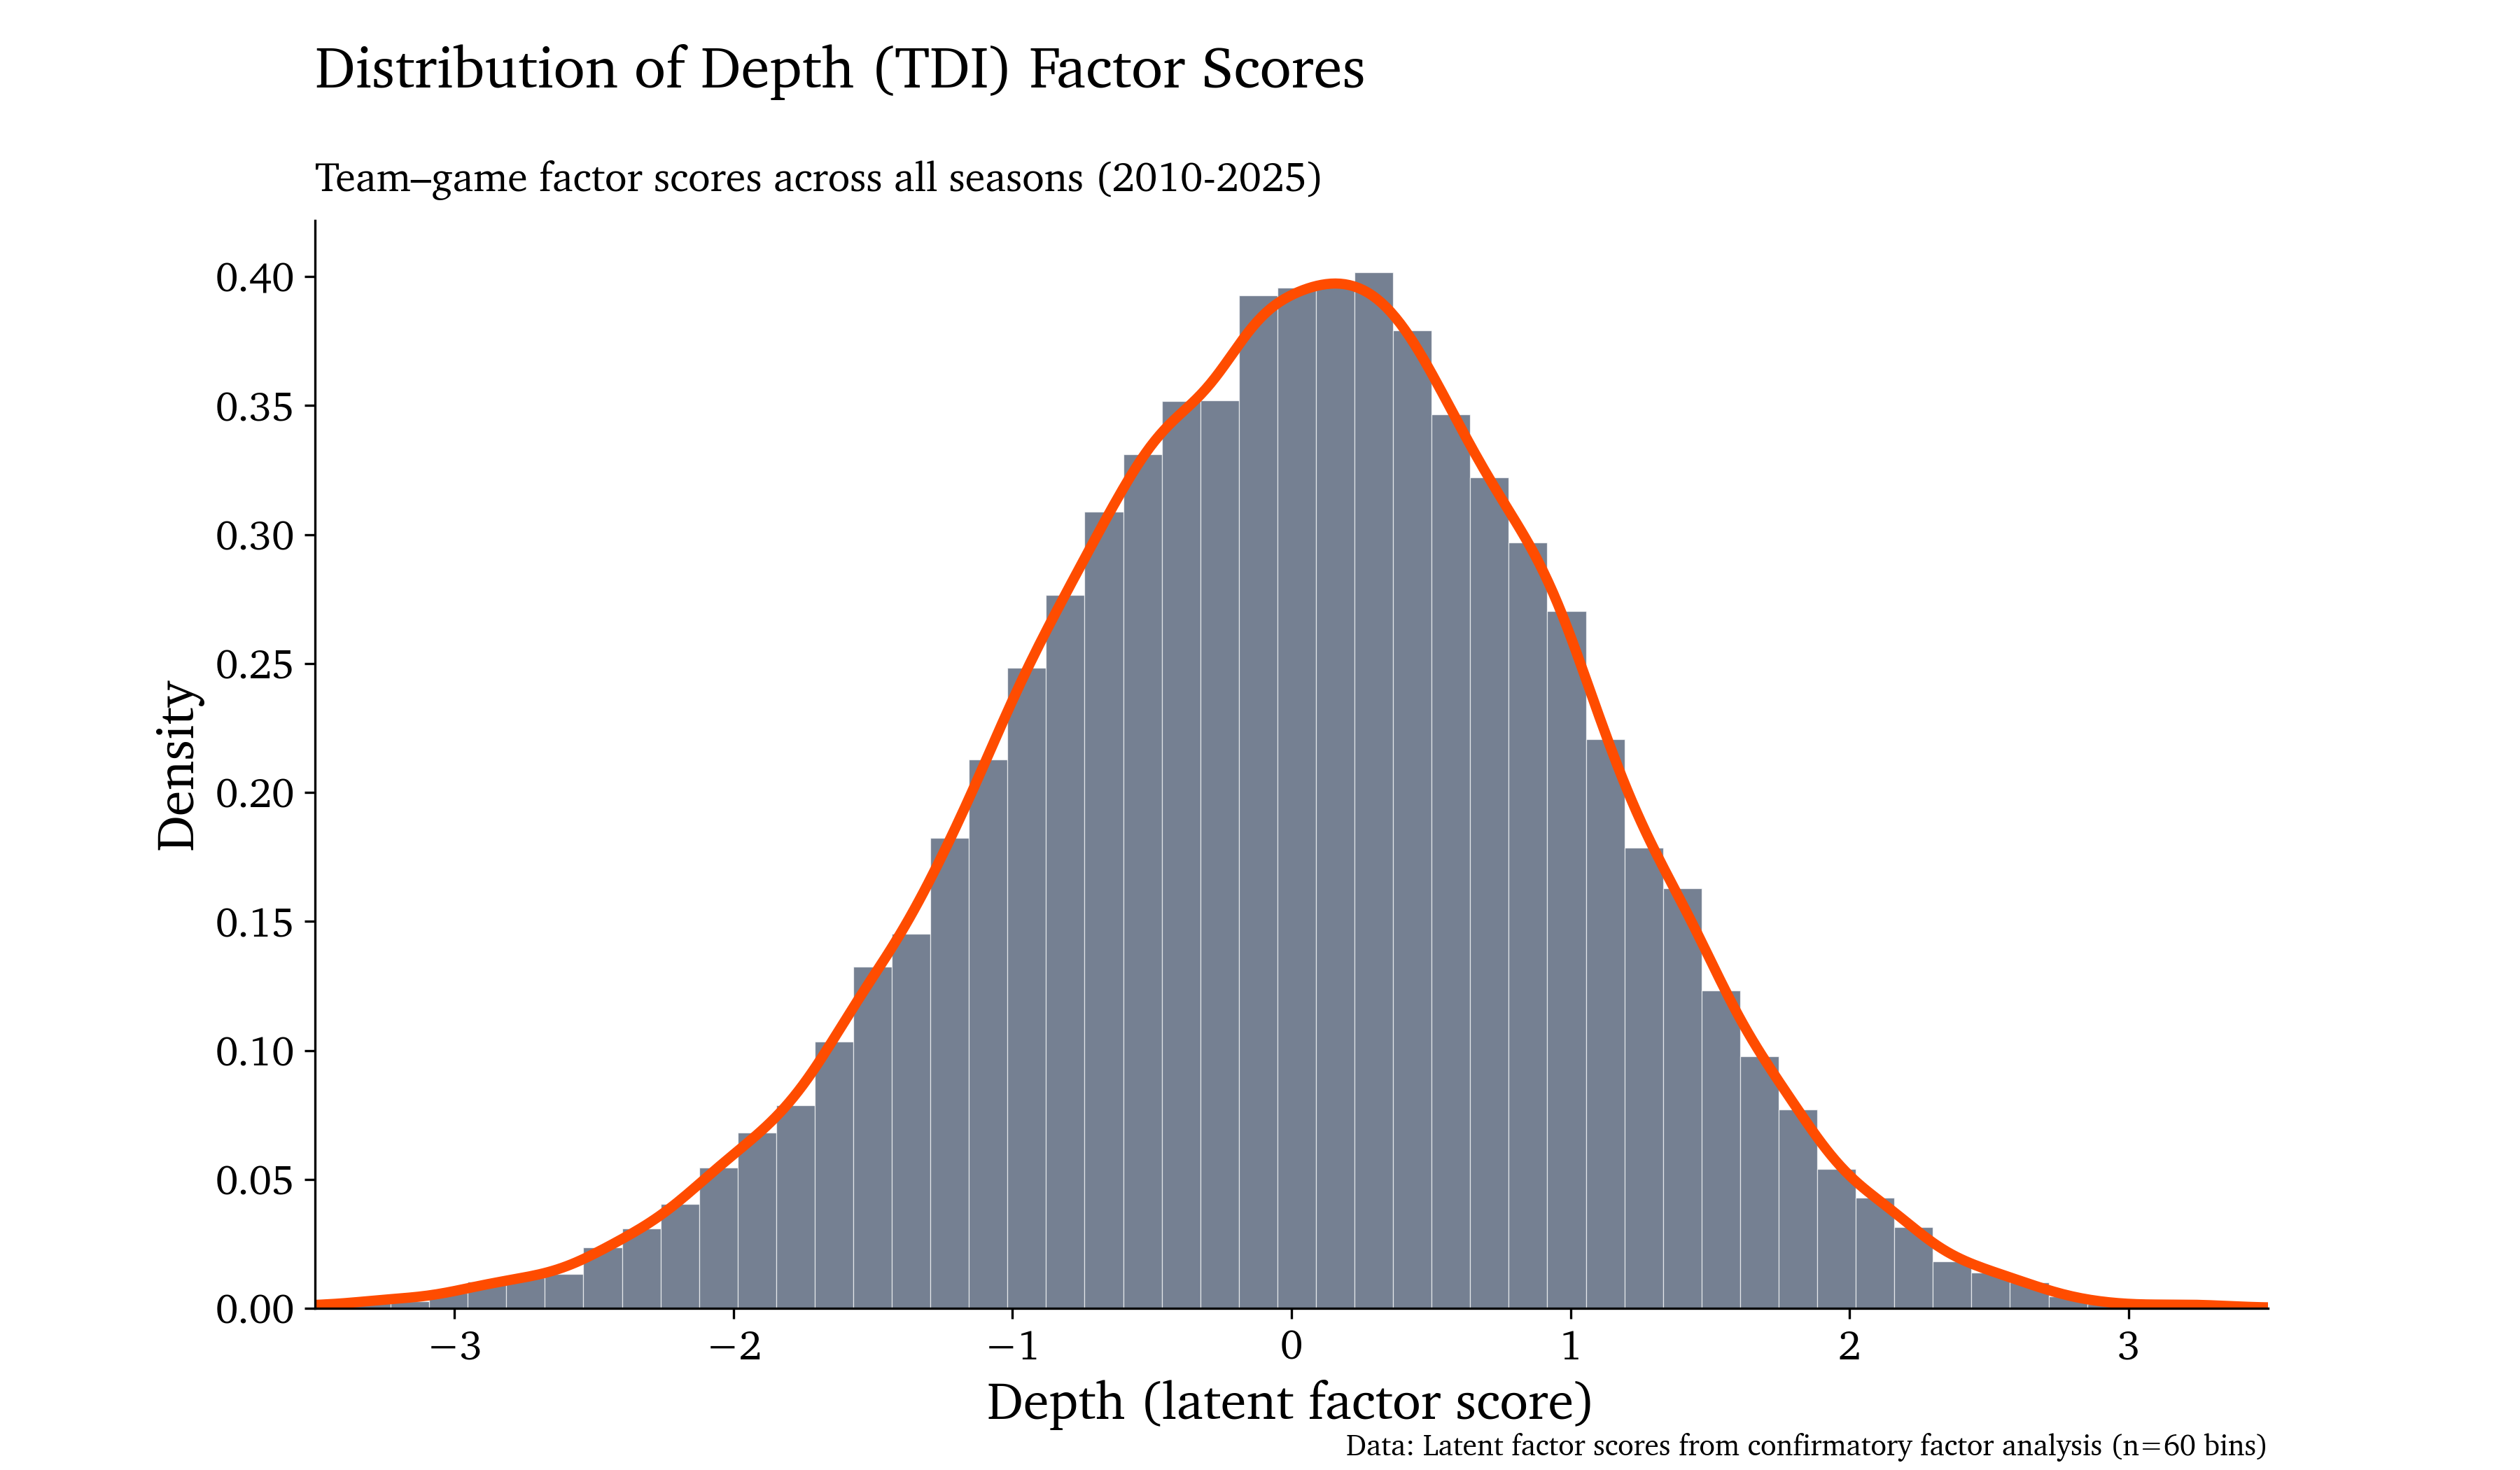
Once we have the factor scores for the TDI, we can look at how depth actually behaves. Specifically, I looked at simple descriptive statistics of depth, how depth has changed across seasons, the game-to-game stability of depth, and how depth varies by team. Across all 15 seasons, the TDI follows a roughly normal distribution. While most teams exhibit average depth, we see frequent instances of both highly "top-heavy" games and extremely balanced ones.
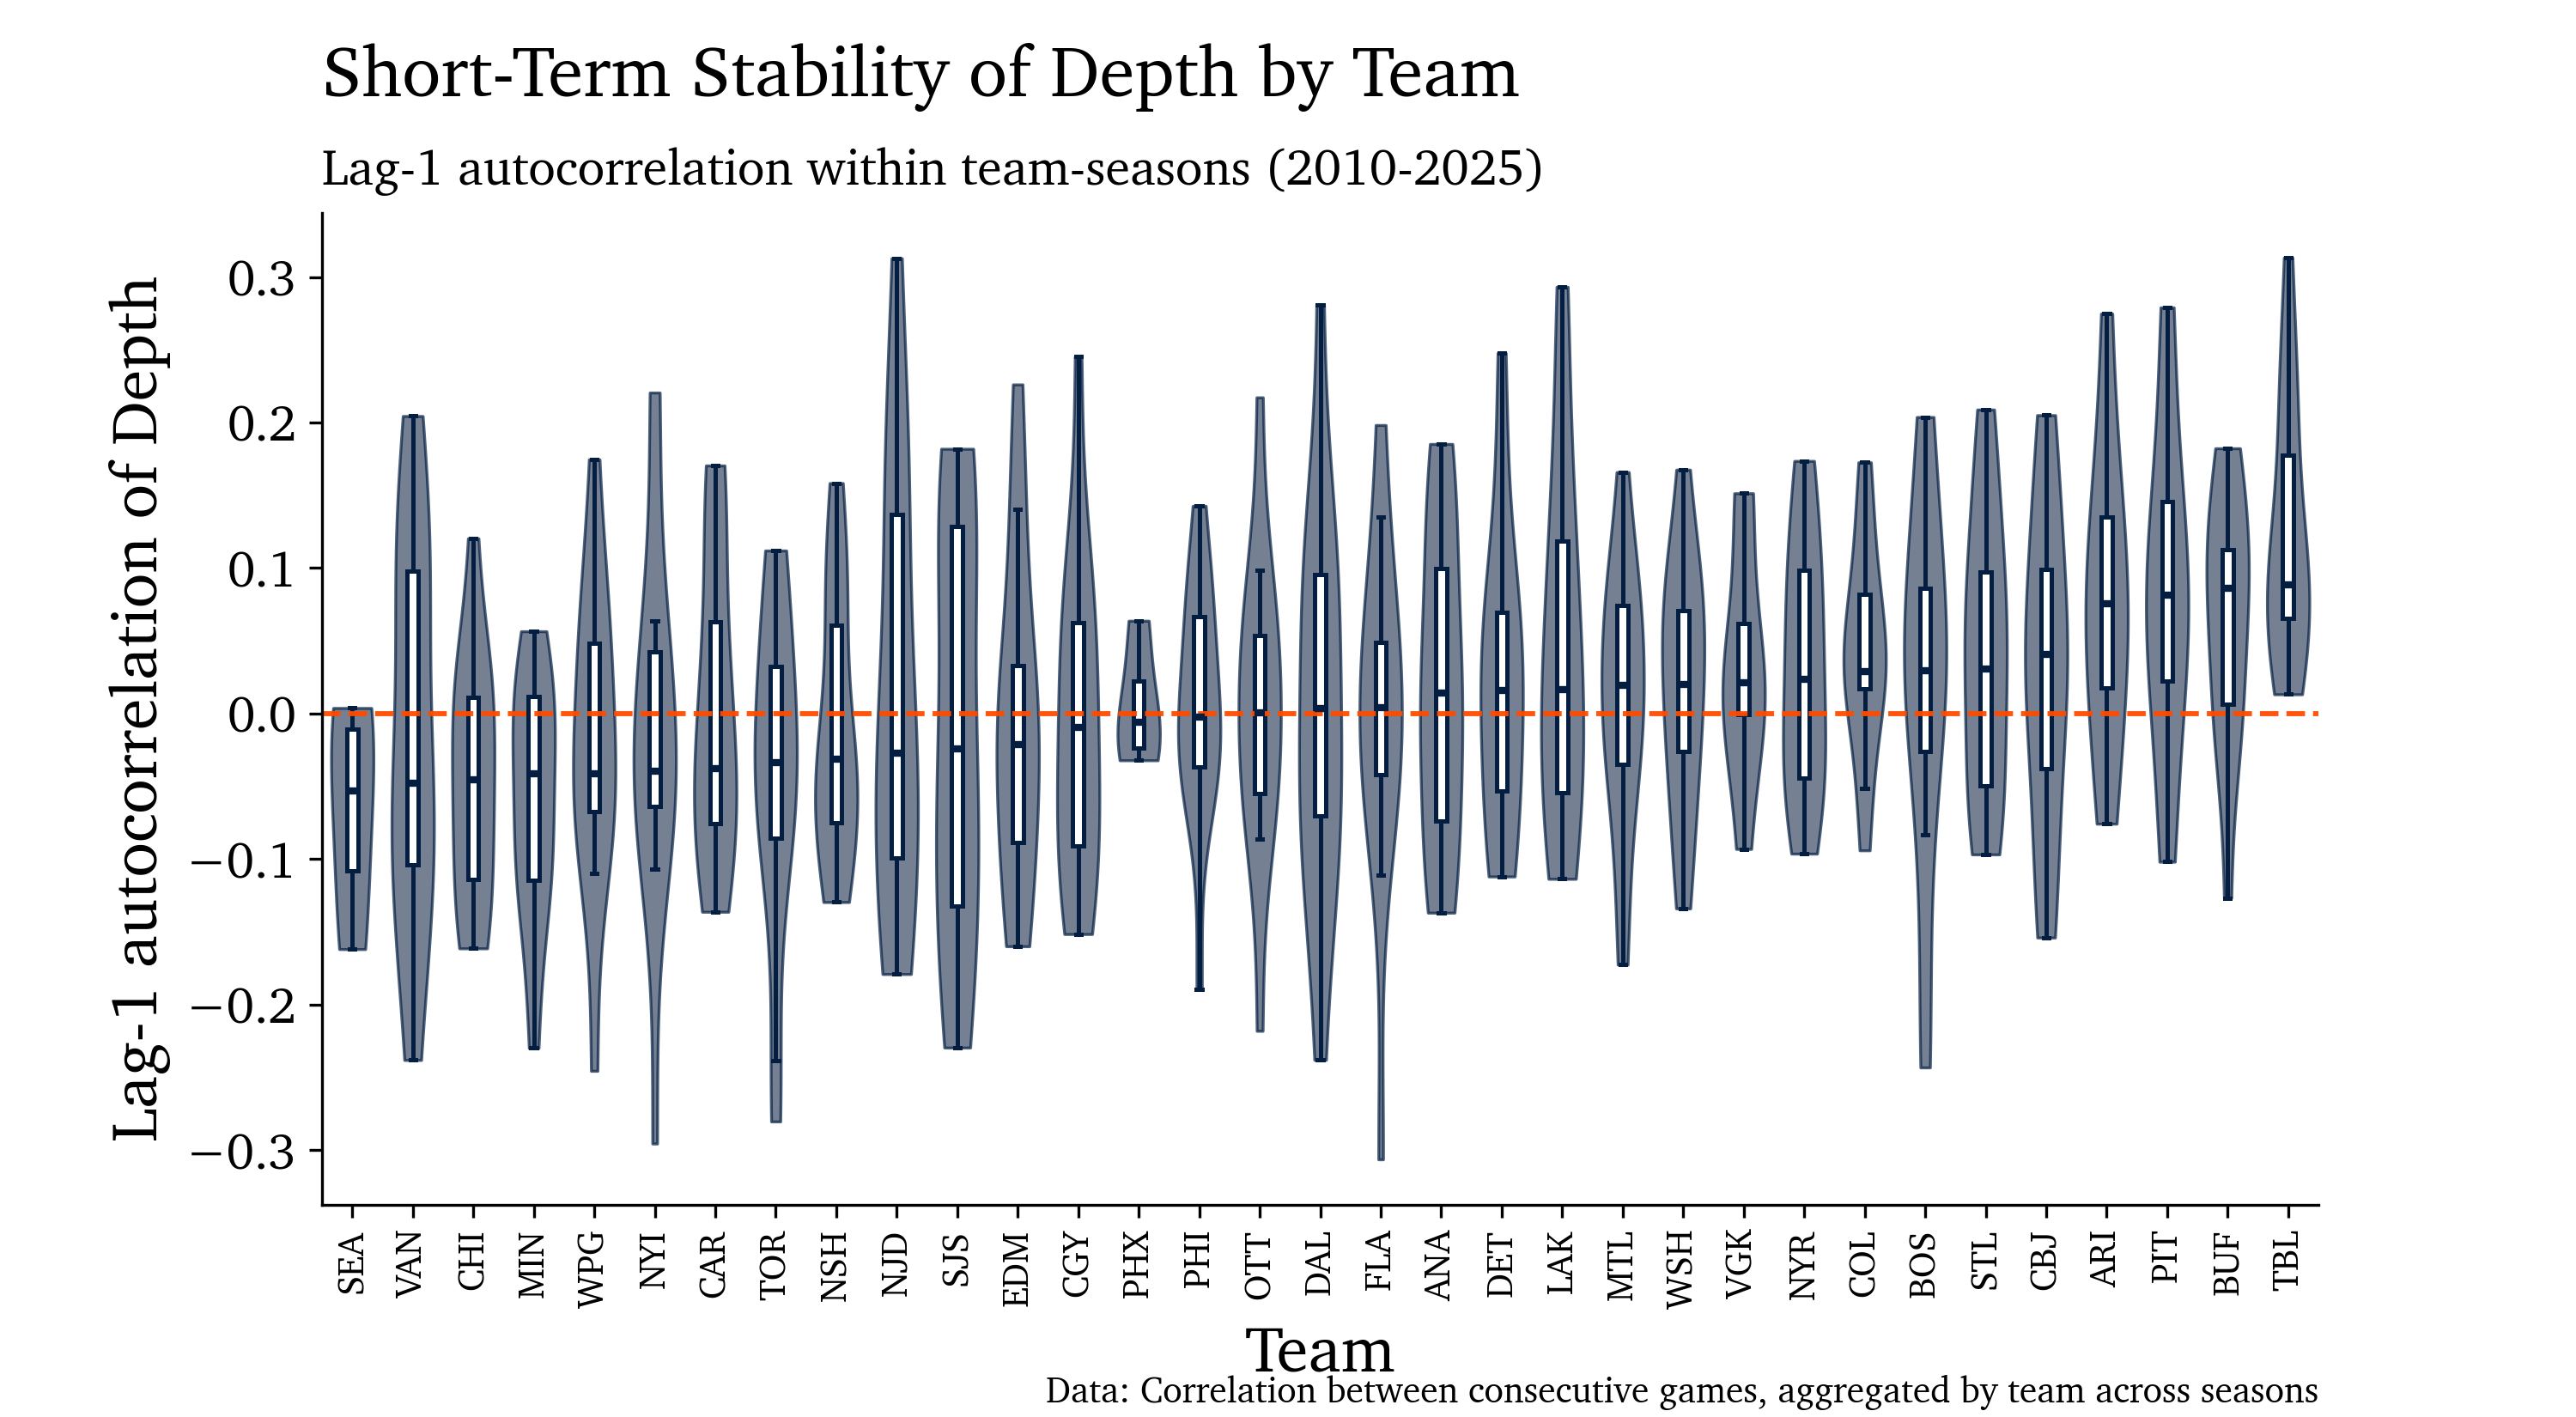
However, the most surprising finding involves the stability of depth. One might hypothesize that depth is a stable trait inherent to an organization. But the data suggest otherwise: only 1.9% of the total variance in depth occurs between teams; the vast majority (98.1%) is game-to-game variability within a single team. This figure below shows that depth in one game has almost zero correlation (r = .013) with depth in the very next game.
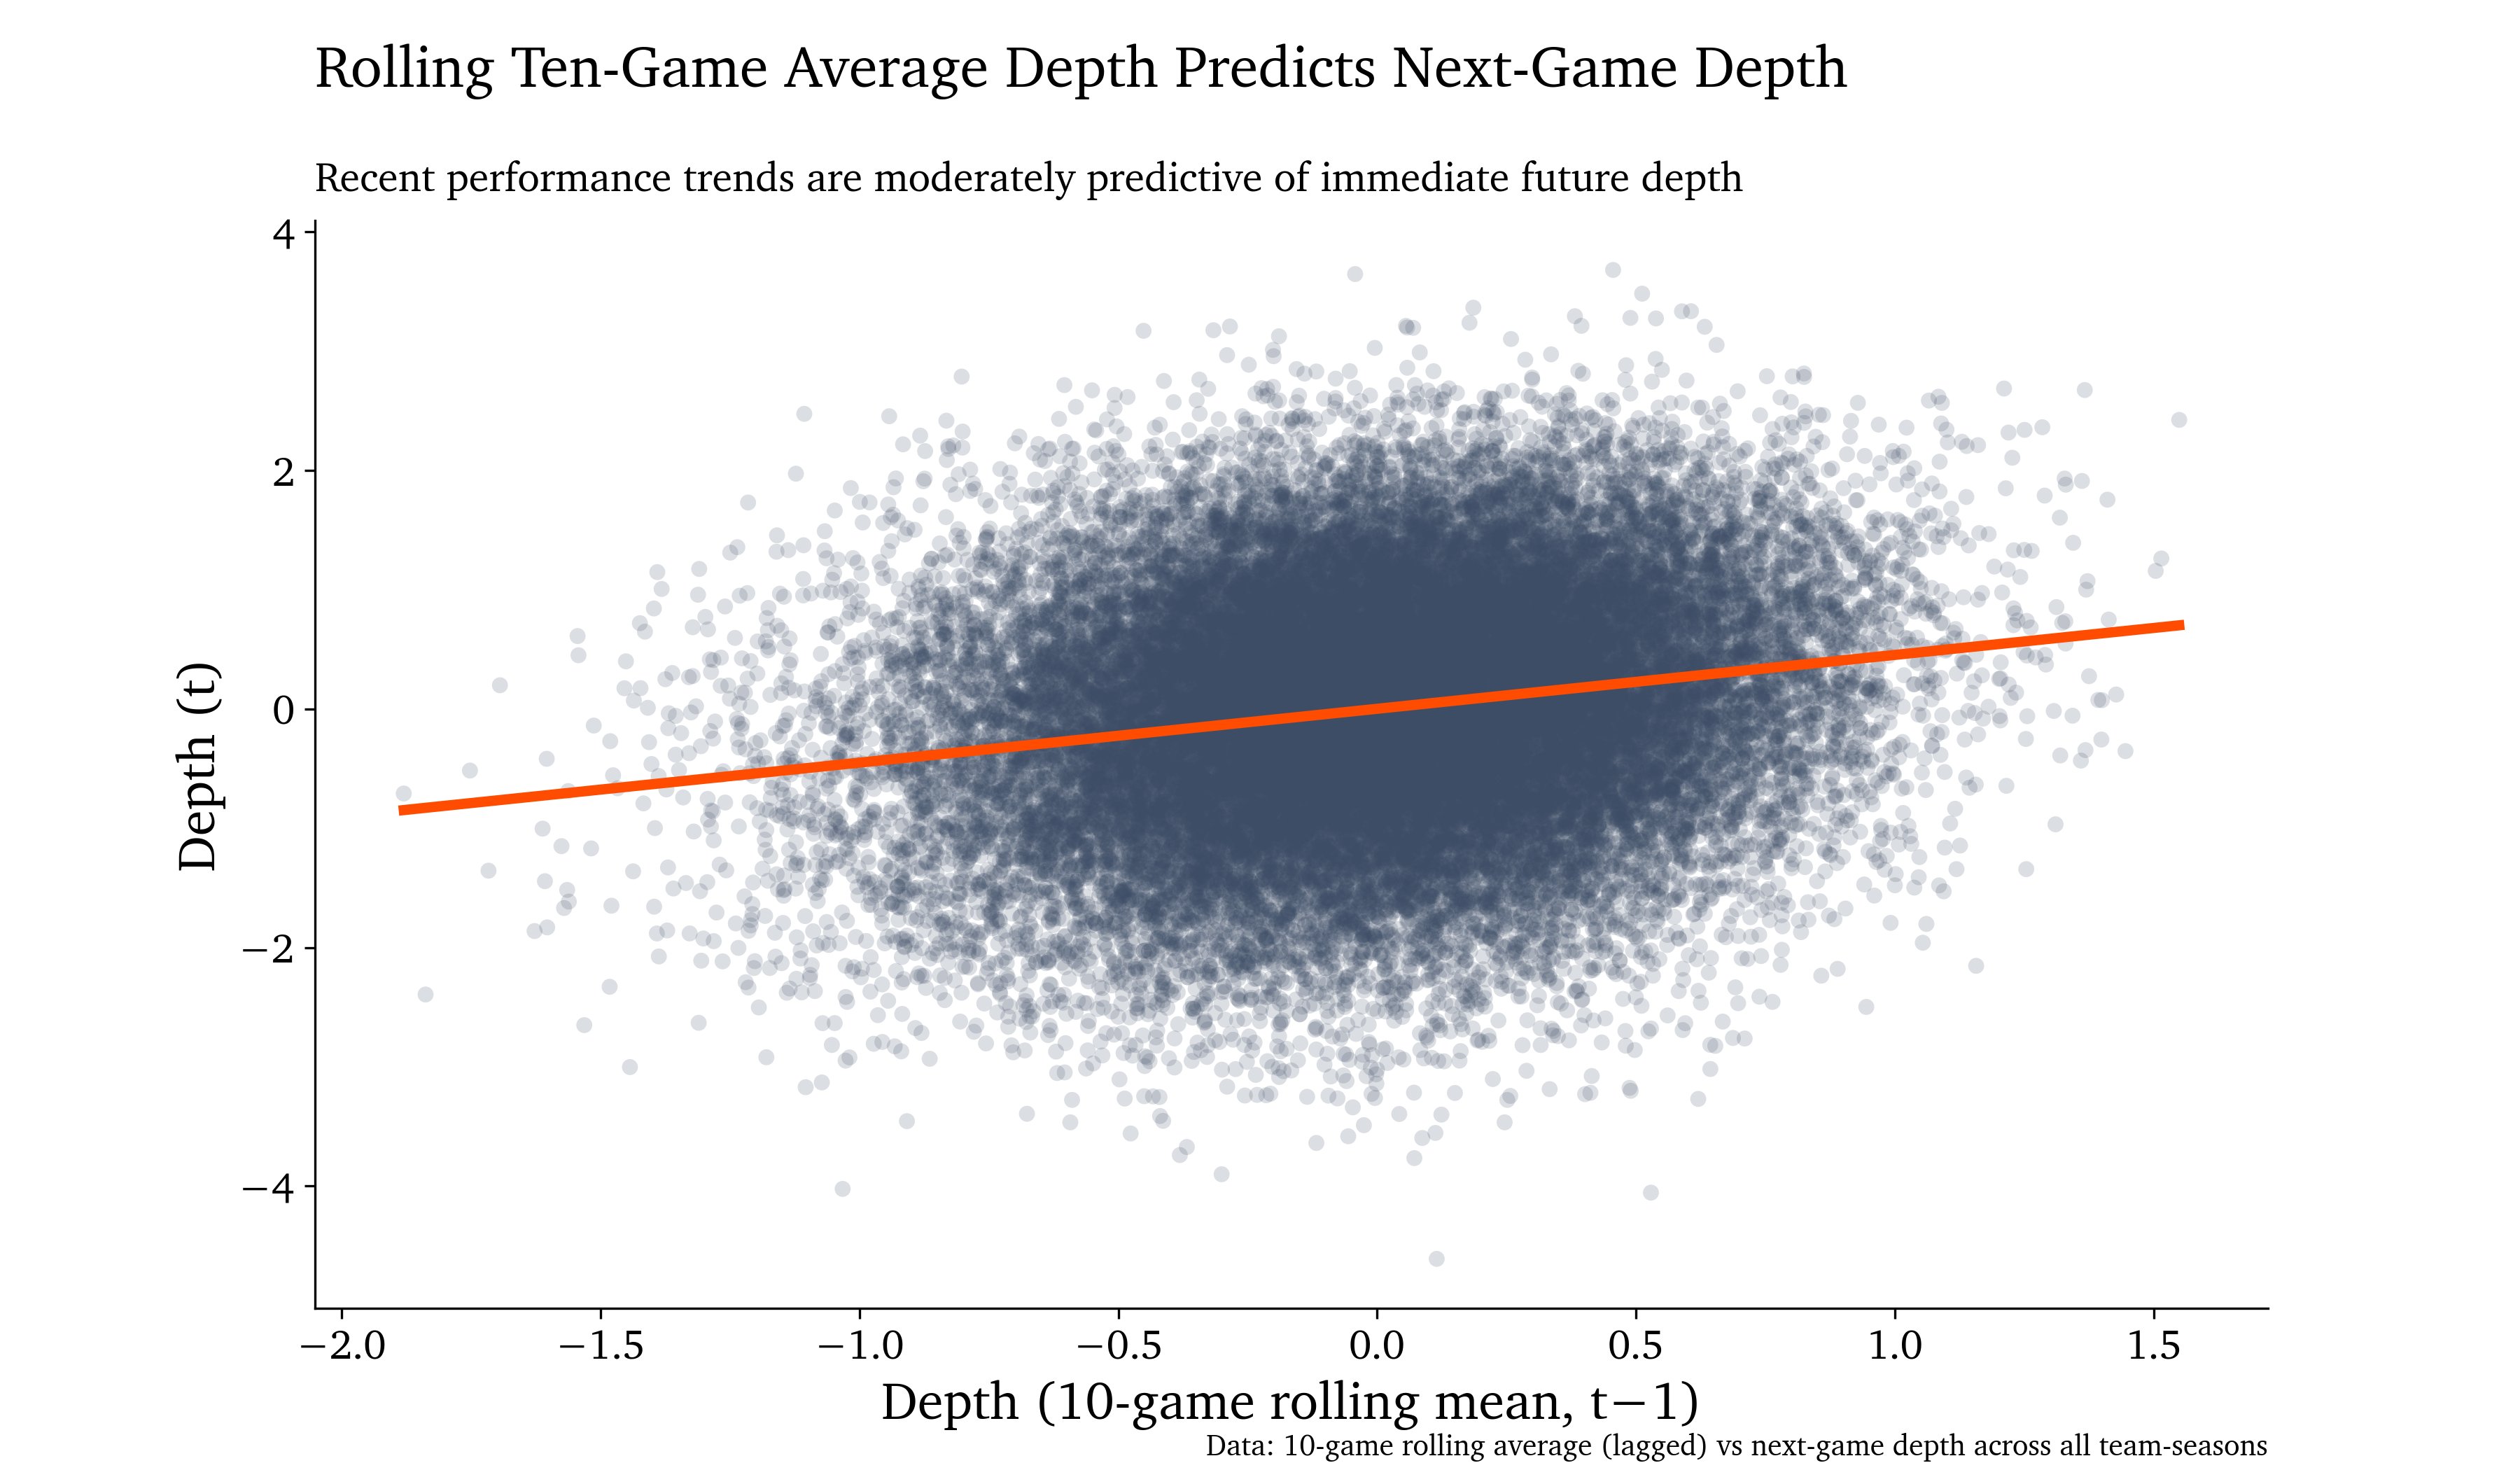
Because of this volatility, I utilized a 10-game rolling average to dampen the noise and identify a sustained state of depth that actually predicts future behavior by predicting next-game depth as a function of each team’s previous 10-game rolling average (as opposed to the depth only in the previous game). As shown below, the rolling 10-game average of depth predicts subsequent depth (β = 0.38, 95% CI [0.35, 0.41], p < .001). This suggests that when a team has been deeper over its previous 10 games, it tends to remain deeper in its next matchup. This suggests that, while single-game Depth fluctuates substantially, averaging across several games reveals a more stable, enduring pattern.
Does Depth Help You Win?
Within a single matchup, the result is paradoxical: playing with more depth than your opponent on a given night actually predicts lower chances of winning (β = –0.046, 95% CI [-.075, -.018], p = .001). However, when we move to the 10-game rolling average, the trend flips. Teams that have been playing with sustained depth over their most recent stretch are significantly more likely to win their next matchup (β = 0.096, 95% CI [.067, .124], p = .001). This predictive power remains significant even when controlling for traditional metrics like total shot volume and possession differential.
But that analysis only tells us that depth and winning go hand-in-hand—they don't show that depth measured before a game can actually predict the outcome of that game. To test predictive validity, I used a leave-one-season-out (LOSO) cross-validation approach. For each season from 2010-2025, I trained a logistic regression model on the other 14 seasons, then tested its predictions on the held-out season. The predictor was the difference in 10-game rolling average depth between home and away teams (lagged by one game to prevent data leakage). I also included rolling averages of expected goals (xG) and Corsi-for (CF) as control variables to test whether depth adds predictive value beyond standard volume metrics.
The depth model outperformed the baseline "home team wins" model in every single season, with accuracy improvements ranging from 0.3% to 5.3% and consistently lower log loss. Importantly, depth remained a significant predictor even after controlling for shot volume and quality, demonstrating that roster balance captures something distinct about winning that goes beyond simply generating more chances.
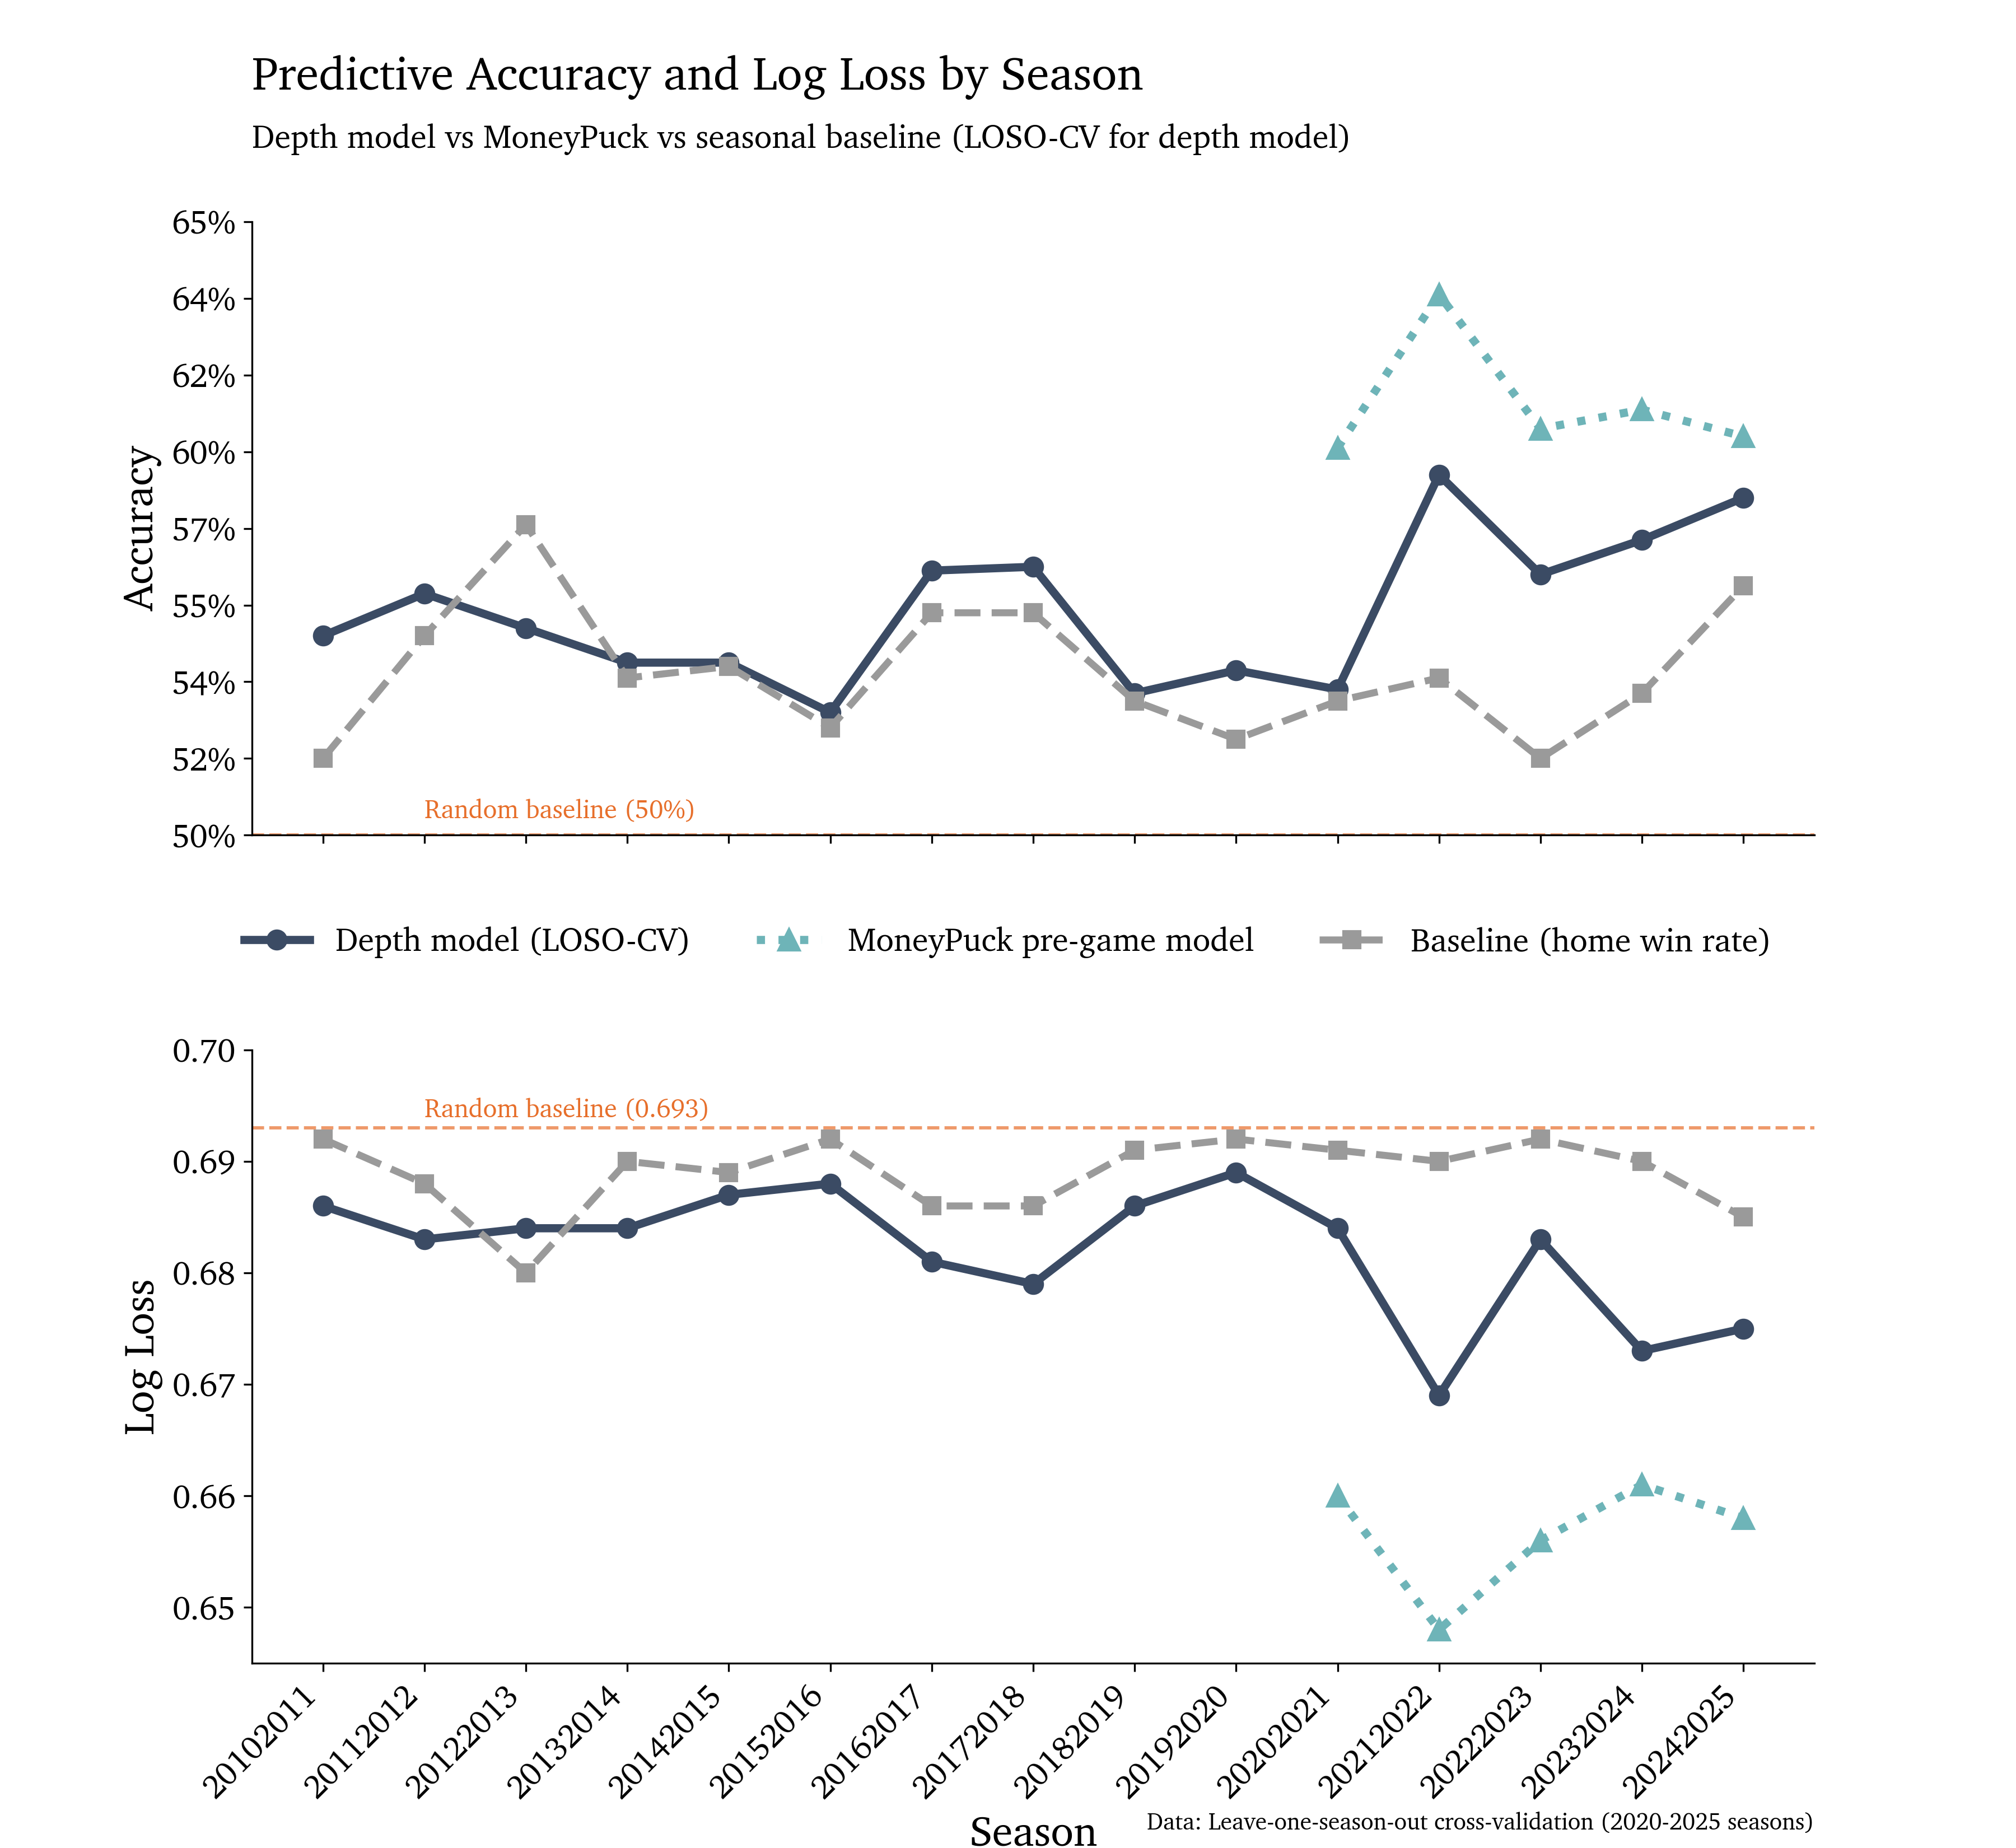
Naturally, this model performs worse than Moneypuck's game prediction model. If such a depth-based model was actually predicting better than Moneypuck, I would have gone spelunking for errors in the data. But the fact that depth adds meaningful signal, even in the presence of shot quality and volume metrics, suggests it's capturing something real about team capability.
Why Does Depth Help you Win?
I wouldn't be a very good psychologist if I wasn't even slightly tempted to try to find a mechanism. One theory is that depth leads simply to more offensive volume: more players contributing means more shots on net, and more shots on net means more goals. One alternative is that depth could lead to higher offensive quality: a balanced roster puts distributional pressure on an opponent that allows for more high-danger looks.
To test these competing explanations I used mediation analysis; a statistical technique that asks "through which pathway does X influence Y?" In this case: does depth influence winning through shot volume (total shots and Corsi-for), shot quality (expected goals), or both?
While depth does increase both volume and quality metrics, only the quality pathway matters for winning. When you account for expected goals (xG), additional shot volume actually becomes a negative predictor of winning. This is what's known as a suppression effect: once you control for shot quality, extra shots without danger may actually be a sign of desperation; low-percentage attempts from the perimeter, blocked shots, point shots into traffic, etc.
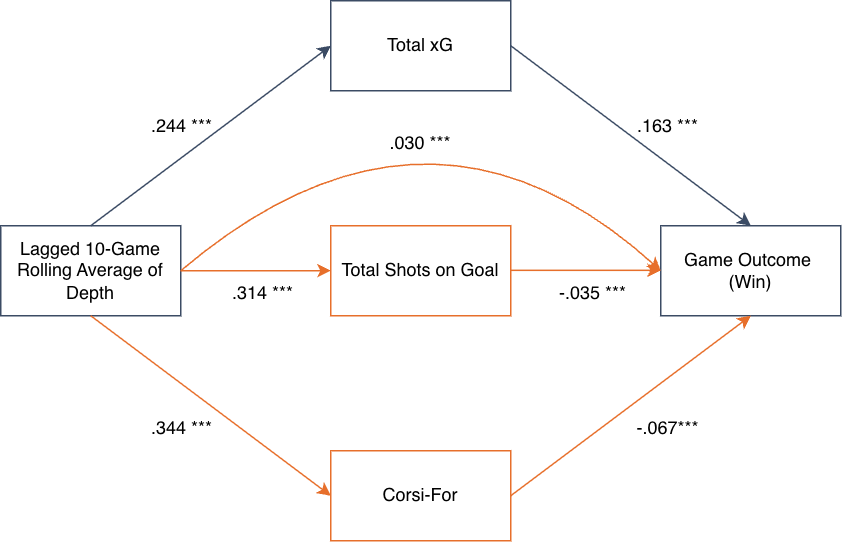
This diagram shows Depth leading to higher xG, SOG, and CF. Only the indirect path from xG to "Winning" is positive and significant. Depth contributes to winning primarily by creating high-quality scoring opportunities, not merely by increasing the quantity of attempts.
This suggests that depth's value is via creating dangerous chances across all four lines. When your third line can create a 2-on-1 rush or your fourth line forces a defensive breakdown, those are the high-leverage moments that convert depth into goals. The shallow team might match your shot total, but they're doing it with low-quality volume once their top line peters out.
Depth → Quality Looks → Winning.
Conclusions and Future Directions
Over 15 years of NHL data comprised of millions of plays and shifts, the TDI has shown that depth is a statistically robust, latent construct that captures a dimension of performance that conventional metrics like shot counts alone cannot. It moves us away from pure speculation and toward a formal quantification of roster balance.
This analysis opens up a ton of interesting analytic windows that I will continue to explore:
The Salary Buffering Effect: Does my measure of depth correlate with salary balance, a traditional proxy for depth? Do teams with less concentrated payrolls actually manifest more functional depth?
Roster Shock Resilience: Does high depth allow a team to "absorb" performance shocks, like a key injury to a top player, with less decline in effectiveness?
The Goalie Interaction: Anecdotally, I have noticed that when a low depth team wins a matchup it comes alongside an overperforming goaltender (or, conversely, your opponents goaltender faltering). How does skater depth interact with goaltending? Does a high-depth roster compensate for a league-average goalie, or do they operate independently in predicting outcomes?
Importance of Depth: The depth leave-one-season-out model seems to be a bit more accurate in the most recent years, since 2020. Does this suggest that depth is becoming a more important factor in NHL success?
Sports discourse is full of references to intangibles. By applying the tools of psychometrics to the ice, we can open up an entire new world of measurement and prediction in sports analytics.