I think if you were to look at the website as it exists right now, it might appear a little bit nonsensical. Like, why is everything (especially the matchups) so focused on depth and goaltending? Surely there are more important things? Well, you would be right! So I'm writing this brief post to kind of explain my philosophy and vision for this website and where it's going.
Depth isn't the only thing that matters, But its the only thing I've really fully fleshed dout.
Site-Guiding Philosophy
My main goal here is to build something I haven't really seen represented on other stats focused websites. All those other sites are great, but what I've noticed is that unless you're a total stats nerd those sites are often overwhelming. They can sometimes be overwhelming even if you are a stats nerd. So, what if you want to just see the game at a glance, either while you're watching live or in cases where you can't? Has the game been fast or slow? Has one team been physically dominant, or are they evenly matched?
I want to use my background and perspective to try and build out a more narrative forward site so someone who isn't particularly interested in the stats can pull up a game dashboard and see what's going on, beyond what you'd get from just raw data tables. I want all the metrics to be really intuitive and understandable up front, with a more detailed piece behind for those curious. And then even behind that, the academic style papers behind that (when necessary) for those who care about that. One step deeper, the data, the code, the robustnessness checks, etc.
It's not super compelling to look at a dashboard or figure and see the output of some statistical model. It's also not super accurate to just have rhetorical data points up front that don't tell the whole story. But, when the robust findings exist in the results of some fancy statistical model, I don't mind just rhetorically making the point up front with glossier exemplary data points.
So, I'm going to keep building more sophisticated models (e.g., the depth latent variable models) behind, and presenting more understandable and digestable stats up front (e.g., normalized depth balance bars).
What's next?
This all came about when I realized that there are a lot of constructs I hear commentators and fans use that haven't really (to my knowledge) been super rigorously defined and measured. Also, hockey stats tend to focus really heavily on just predicting wins, or predicting a player's future performance. Obviously valuable endeavours, but what I think is also missing here is trying to understand some of these intangibles, and understanding some of the dynamics of hockey at the team, game, and season level as opposed to the player level.
What I'm working on right now is a more in depth model to measure physicality, using the same methodological framework as my depth model. Following this, I want to try and keep quantifying different elements of the game. The end goal is to be able to build these metrics out in a more robust way so that you can look at a dashboard and get a sense of the "shape of a game."
That way, you can look at matchups before a game and see how teams stack up, you can get a sense of how games are being played, etc.
Followed by defensive success or something, pace. The end goal will be to build out these metrics to exist along side depth and goaltending, so you can look at matchups ahead of time and see how teams have been in the season so far, waht to expect, and then watch a game play out live.
I'm also doing random deep dives. Just analyzing data on things that catch my attention and I think are interesting. For instance, working on a team travel/schedule inequality deep dive right now.
Wait, so then what was that data in the banner image?
Well, it was pretty much entirely there to capture your attention, and also because I thought it would look weird to not have a banner image. This is just part of an analysis I've been working on; not sure it will ever make it into a post because it isn't super substantive, but I have binned it over to the curiosities page, where I stick stuff I think is fun and interesting but ultimately not that important.
The TL;DR of this analysis is that, as an Oilers fan, I often have this perception that we are the absolute masters of blowing leads. But, at the same time, we are exceptional at absolutely ridiculously improbable comebacks. I mean, just look no further than this game from January 2026. The sharks scored 26 seconds into the first period, and it was 2-0 95 seconds in.
In fact, that was pretty well it. Sharks scored again, and it was 3-0 going into the third. At that point, MoneyPuck had ~95% chance the Sharks win. Then, over the course of that period, Edmonton scored 3 times: Ninety seconds into the third, and then twice in the last three minutes, tying it with less than a minute to go and then ultimately winning in overtime.
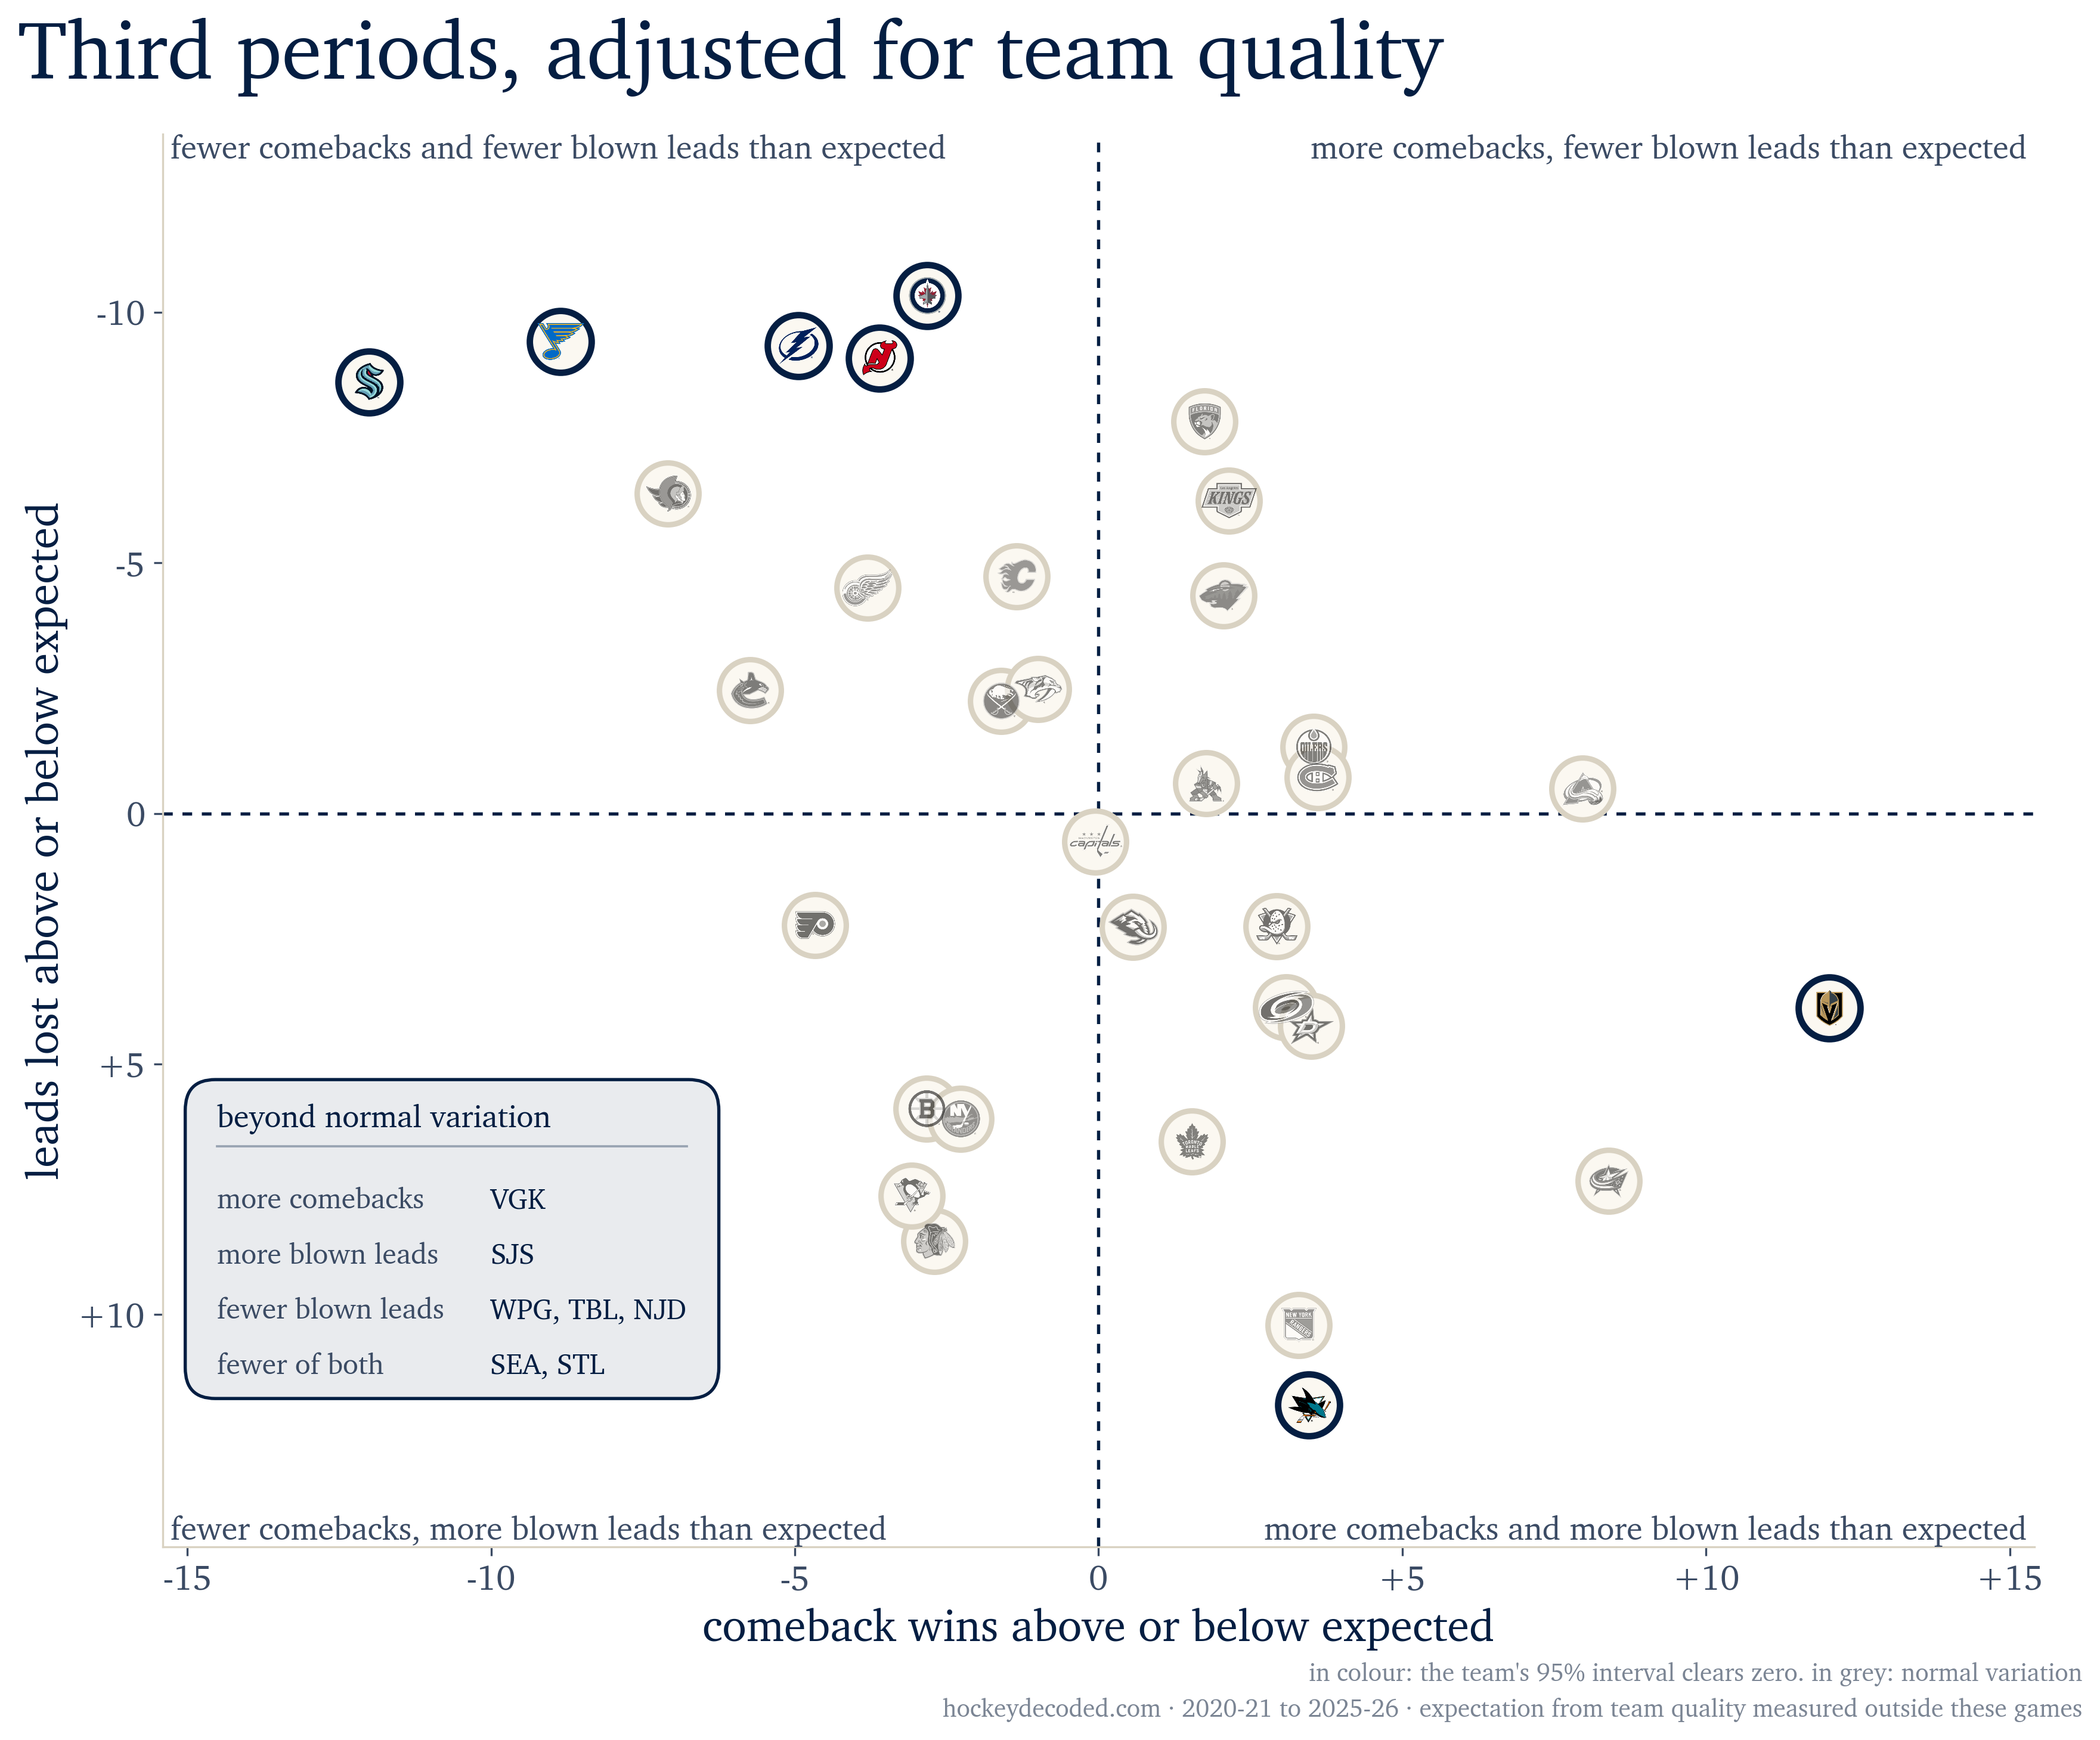
I more so just wanted to know if the Oilers are disproportionately good/bad at making comebacks and blowing leads, and how all the other teams stacked up. As with any analysis there are a lot of ways to slice it, but I just looked at coming into the third with leads, or behind. Are any teams, in this case, more or less likely than expected to blow a lead, come back, or both?
I initially just looked at all "blown leads" and come backs. If you were up 1-0 in the first, then lost the game, that's a blown lead. But doing the analysis it became pretty clear right away that this just tracks team quality. Good teams come back more often, they blow leads less often. It's pretty linear. This is also too loose. Someone always has to score first. I wouldn't say being down 1-0 is really "trailing." So I took a bare bones, but slightly more sophisticated approach to see if teams come back or blow leads more or less "than expected."
Say you play 100 games and in 35 of them you come into the third behind. You win 9 of those. Is 9 good? On its own you can't really say, because good teams come back more than bad teams do, like I said. So I looked at the games that aren't in question instead. In your other 65 you took about 78% of the points available, and teams at that level come back about 15% of the time, which over 35 games is 5. You got 9. So you've come back 4 times more "than expected."
I used the regression output to determine what is inside or outside of the norm of comebacks and blown leads. Most teams are pretty "typical." with a couple outliers. All those teams in color at the top left are bad at making comebacks, but good at not blowing leads. Vegas down on the bottom right is pretty exceptional at making comebacks, and the Sharks are, unfortunately, pretty good at blowing leads.
In any case, just a random little analysis I thought was interesting!